cellxgene-user-guide
Cell-x-gene user guide
cell-x-gene is a single-cell visualization platform developed by the Chan-Zuckerberg initative. It allows to explore single-cell RNA-seq (scRNA-seq) datasets in the web browser without any computational skills. This guide gives an overview of the most important features.
Table of Contents
Portal overview
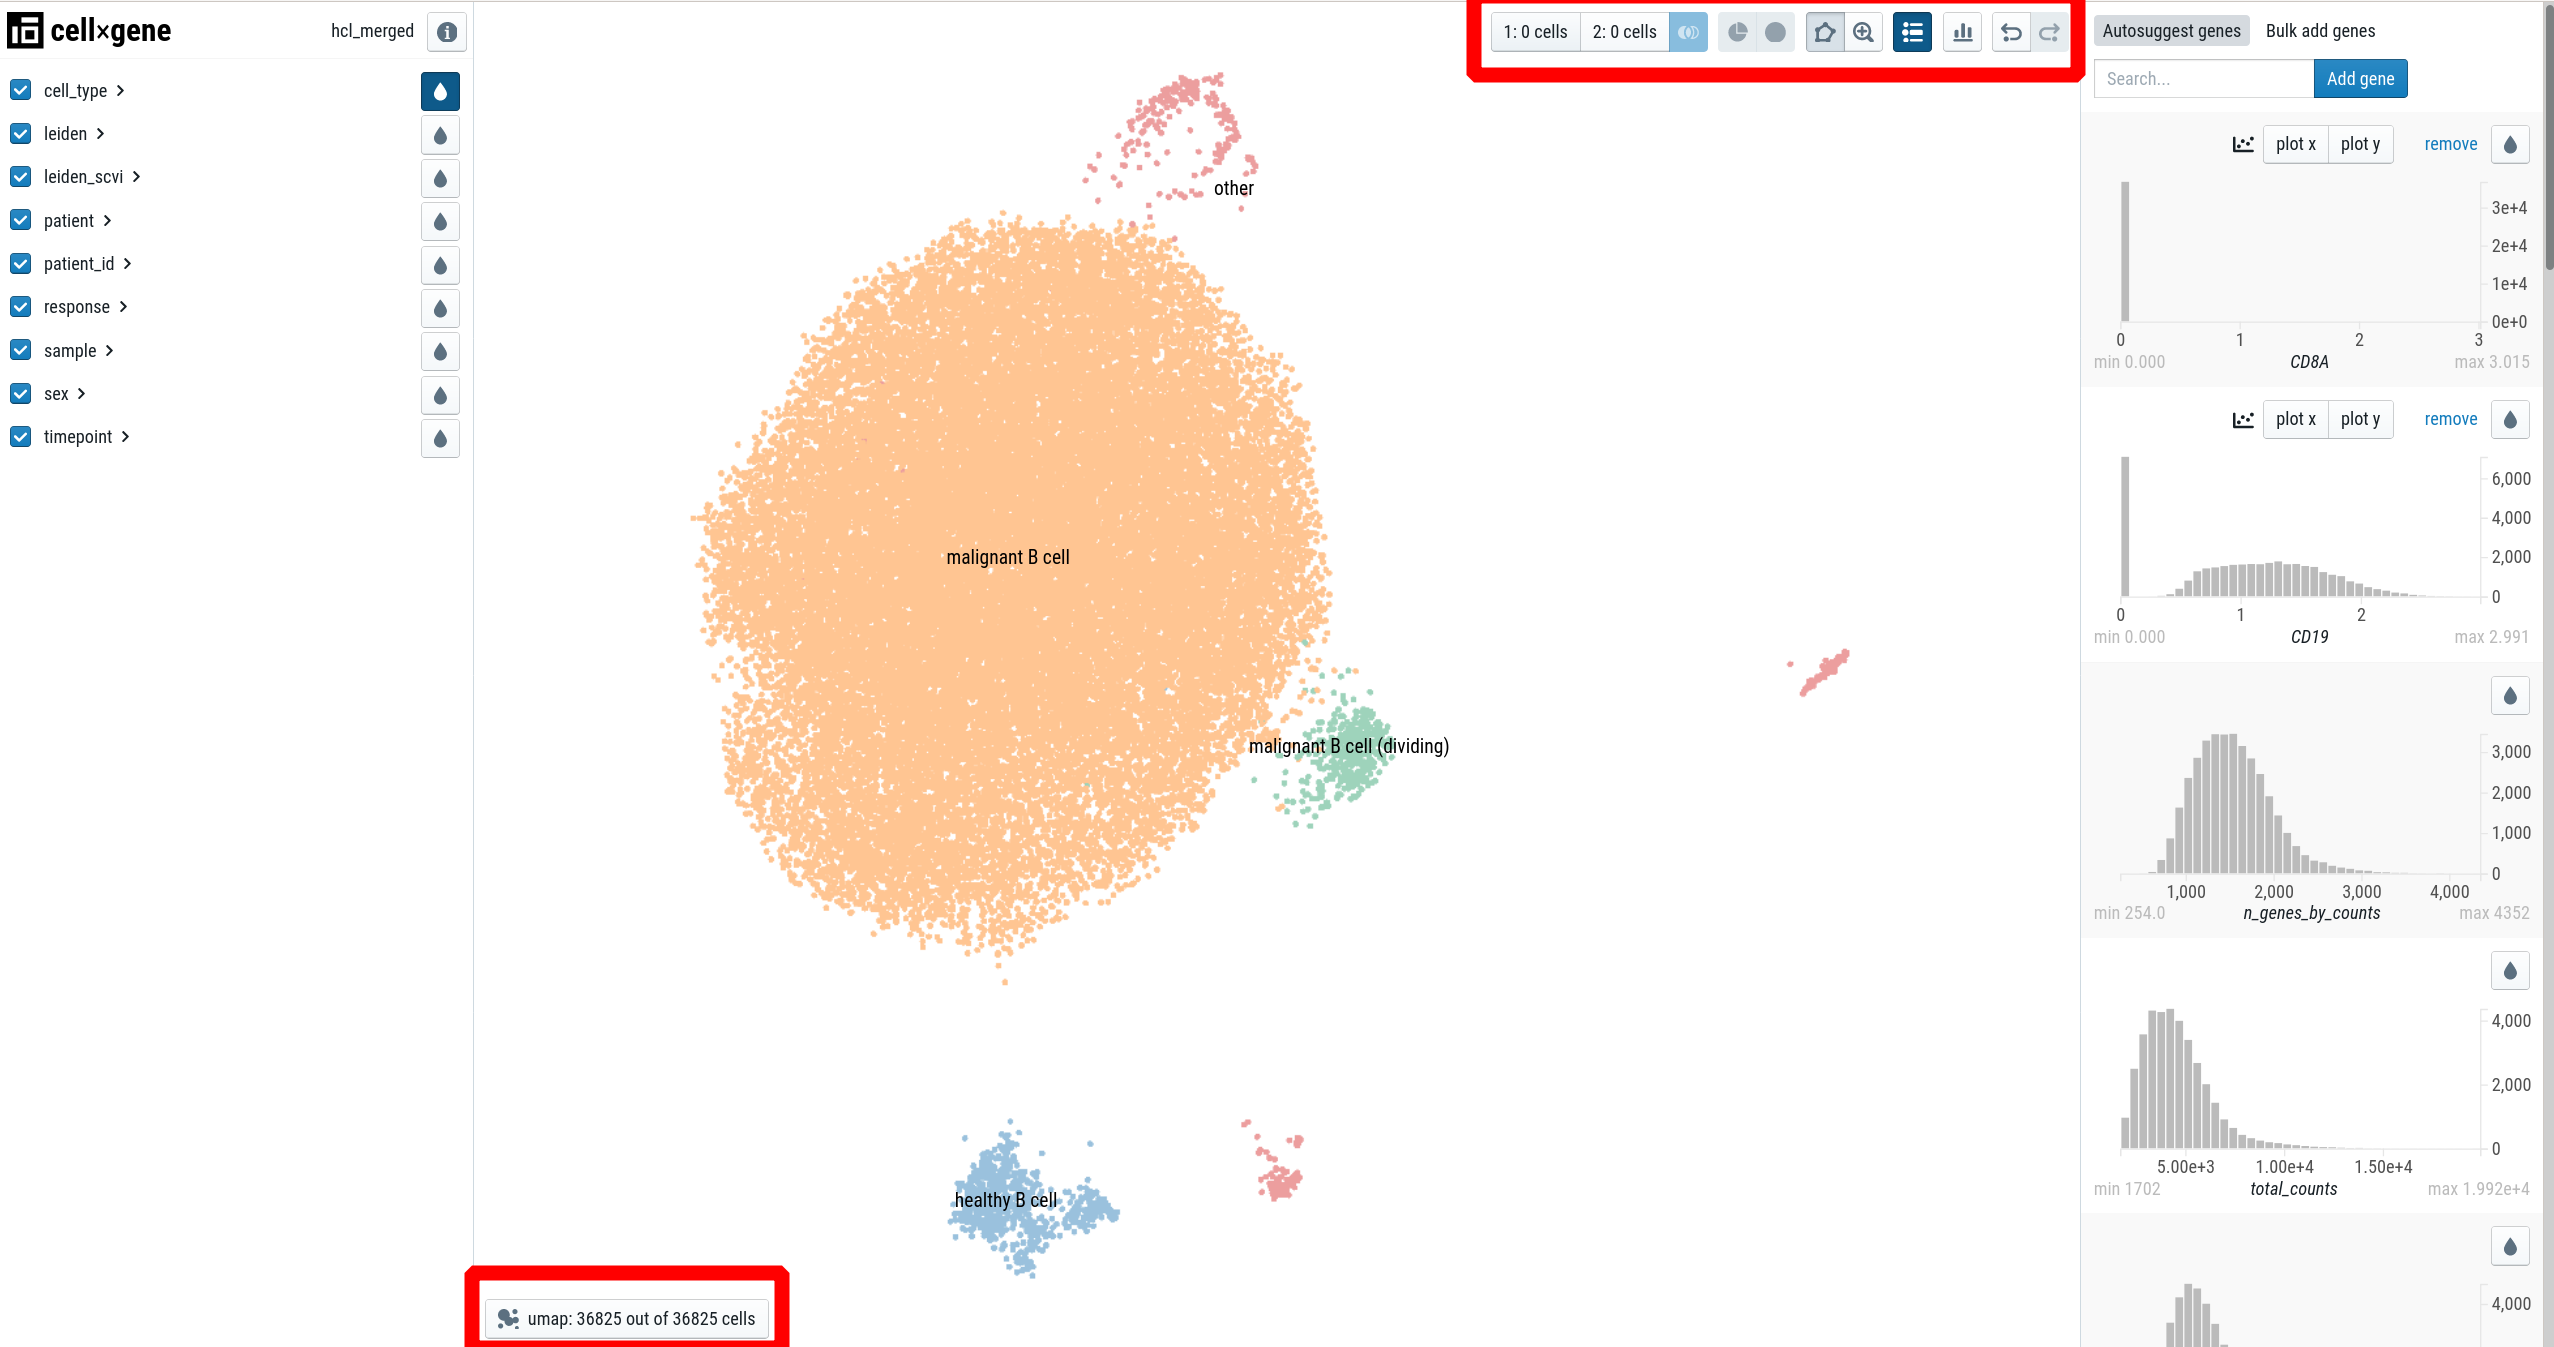
The portal consists of three main panels:
- the left sidebar for categorical annotations, such as patient, cell-type, …
- the main panel, visualizing a embedding of the single-cells (usually UMAP).
- the right sidebar for continuous variables, such as genes.
Additionally, there are two toolbars:
- The “main toolbar” at the right top
- the “embedding toolbar” at the bottom left.
How to color by categorical variables (cell-type, patient, etc.)
In the left sidebar, click on the drop next to a variable. If you open another category (“patient” in the example), you’ll see colorbars indicating the distribution of the category.
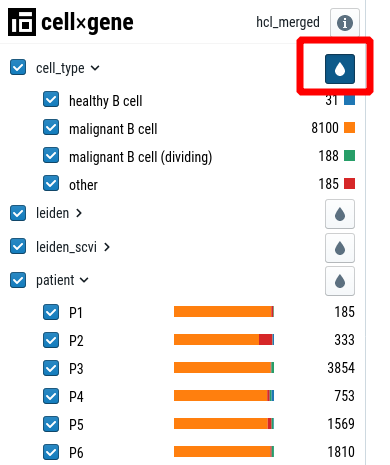
For some variables (cluster, cell-type) it makes sense to overlay the legend on the cell-type plot. To activate this feature, click on the “show labels” button in the toolbar:

How to color by gene
In the right sidebar, enter a gene in the “Search” bar.
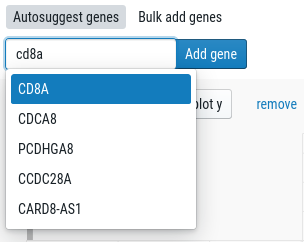
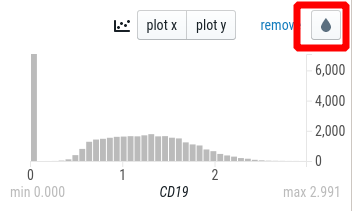
This will add a histogram to the right sidebar. Click on the drop to color the single-cell plot by the gene expression:
How to change the embedding
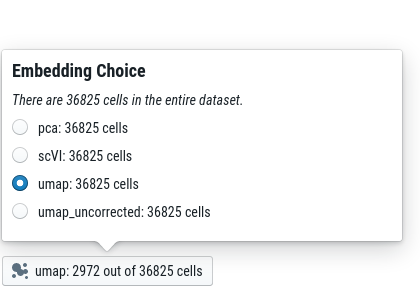
For some datasets, we provide multiple embeddings (usually, that is a UMAP with and without batch correction, respectively). You can choose the embedding from the “embedding toolbar” at the bottom left:
How to analyse a subset of data (e.g. specific cell-type or patient)
There are different ways to select cells in cell-x-gene:
- By selecting categories in the left sidebar
- Using drag & drop on the plot
- By selecting a range in the right sidebar (drag & drop on a histogram)
Once you selected cells, you remove all other cells from the plot by clicking on the “Subset” button in the toolbar:

Once you subset the dataset, all cell-counts, colorbars and histograms adapt to reflect the reduced dataset.
To reset the view to include all cells, use the “Undo subset” button. You can also undo a single step by using the “undo” button:

How to perform differential gene expression analysis
With cell-x-gene it is possible to perform a very simple differential gene expression (DE)-analysis. It does not correct for any biases and only shows the top 10 most differentially expressed genes. This is great for a first glance at the data - if you need a more in-depth analysis, contact your Bioinformaticians.
Once you selected a group of cells, you can assign these cells to either group 1 or group 2 by clicking the buttons in the toolbar:

Once you have both groups filled with cells, you can perform the DE-analysis by clicking on the “Differential expression” button:

The 10 top DE genes will now appear in the right sidebar.