8 Creating publication ready figures
8.1 Predictions on simulated vs. genuine bulk
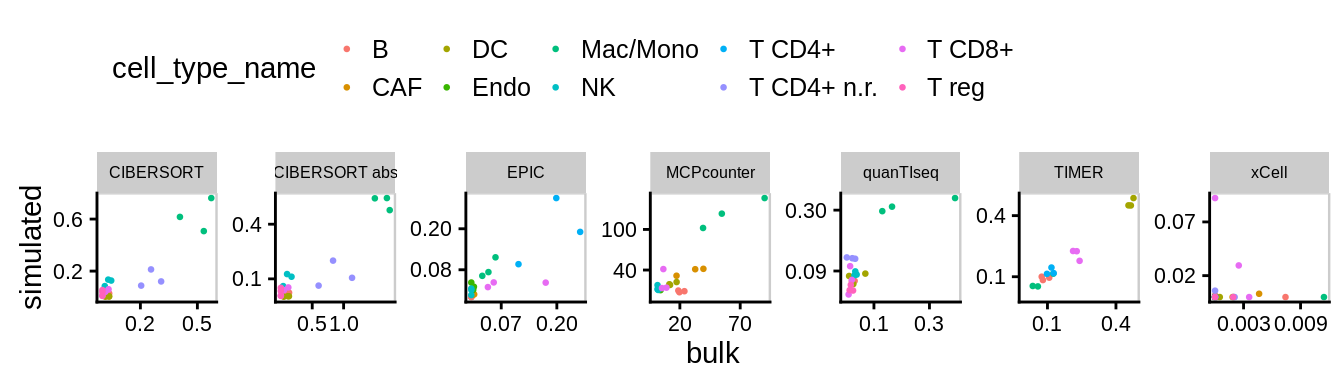
Figure 8.1: Predictions on simulated vs. genuine bulk
8.2 Benchmark results
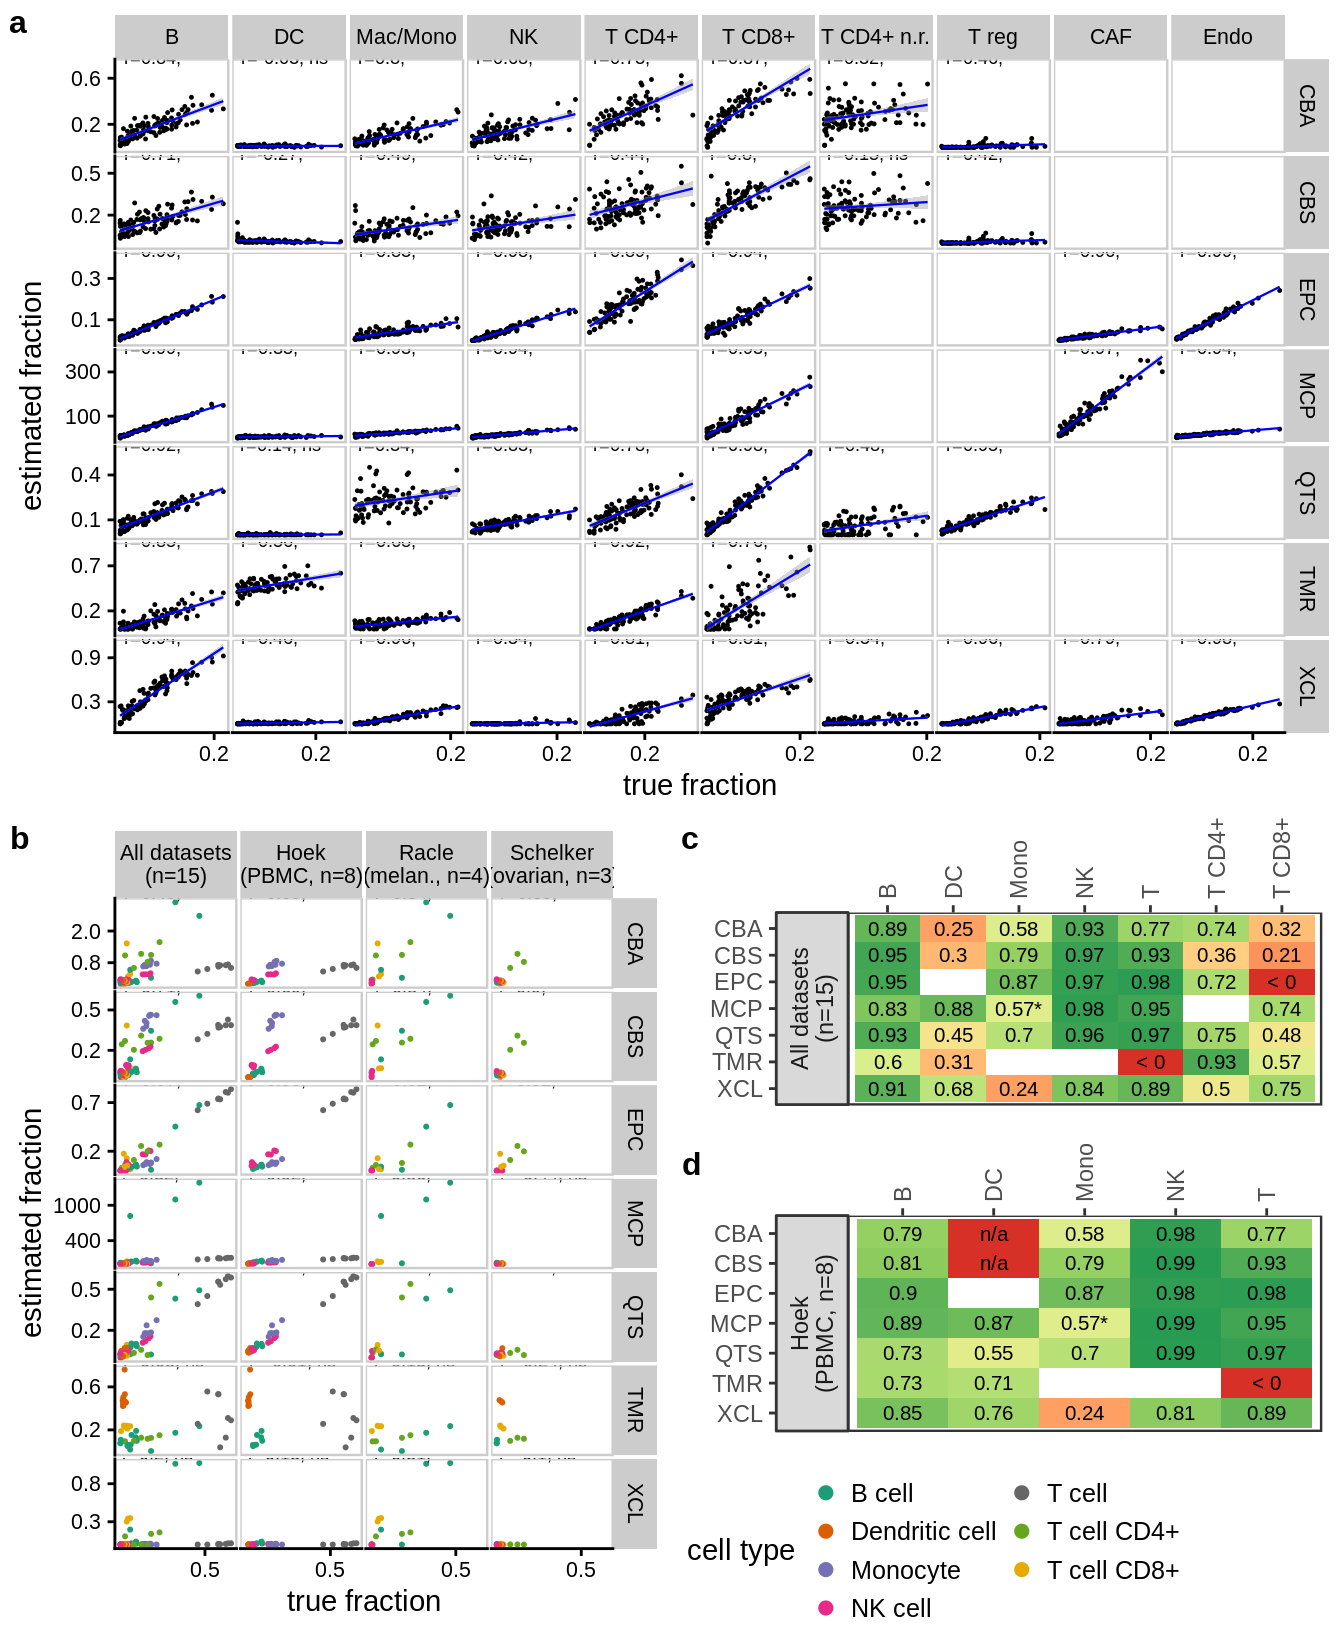
Figure 8.2: Benchmark results main figure.
8.3 detection limit / false positive figure
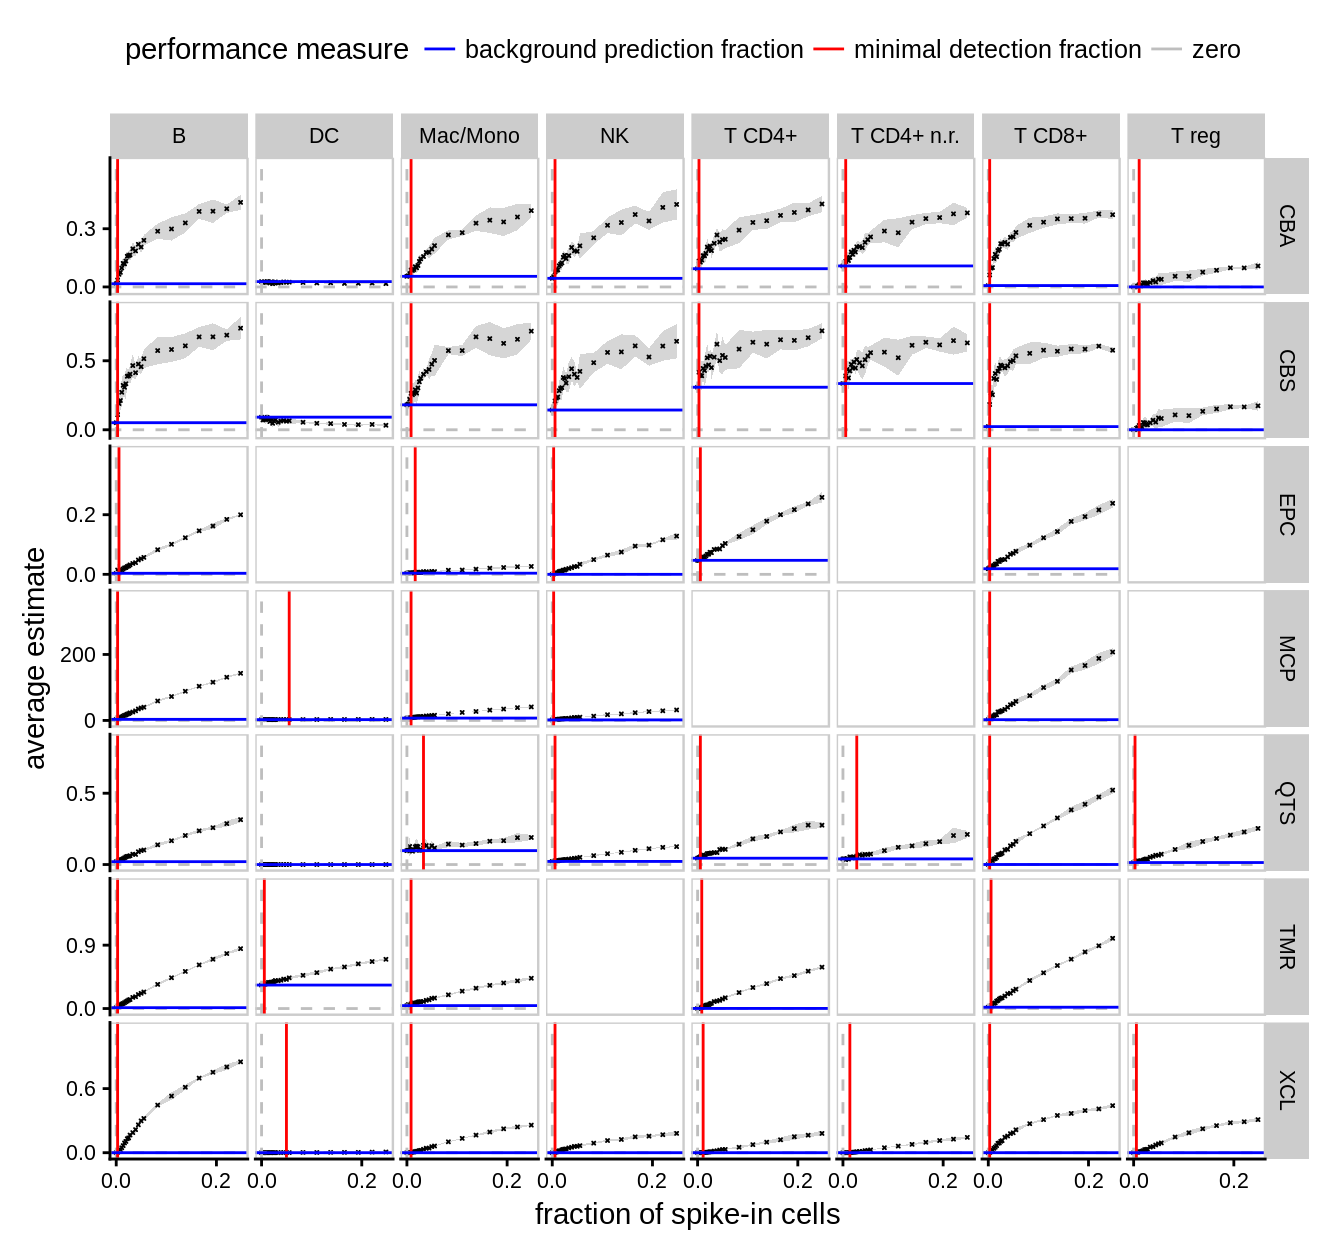
Figure 8.3: Detection limit and false positives.
8.4 Migration charts for Spillover analysis
## Warning in grid.Call(C_stringMetric, as.graphicsAnnot(x$label)): font
## metrics unknown for Unicode character U+207a

## Warning in grid.Call(C_stringMetric, as.graphicsAnnot(x$label)): font
## metrics unknown for Unicode character U+207a
## Warning in grid.Call(C_stringMetric, as.graphicsAnnot(x$label)): conversion
## failure on 'predicted CD4⁺ T cell score' in 'mbcsToSbcs': dot substituted
## for <e2>## Warning in grid.Call(C_stringMetric, as.graphicsAnnot(x$label)): conversion
## failure on 'predicted CD4⁺ T cell score' in 'mbcsToSbcs': dot substituted
## for <81>## Warning in grid.Call(C_stringMetric, as.graphicsAnnot(x$label)): conversion
## failure on 'predicted CD4⁺ T cell score' in 'mbcsToSbcs': dot substituted
## for <ba>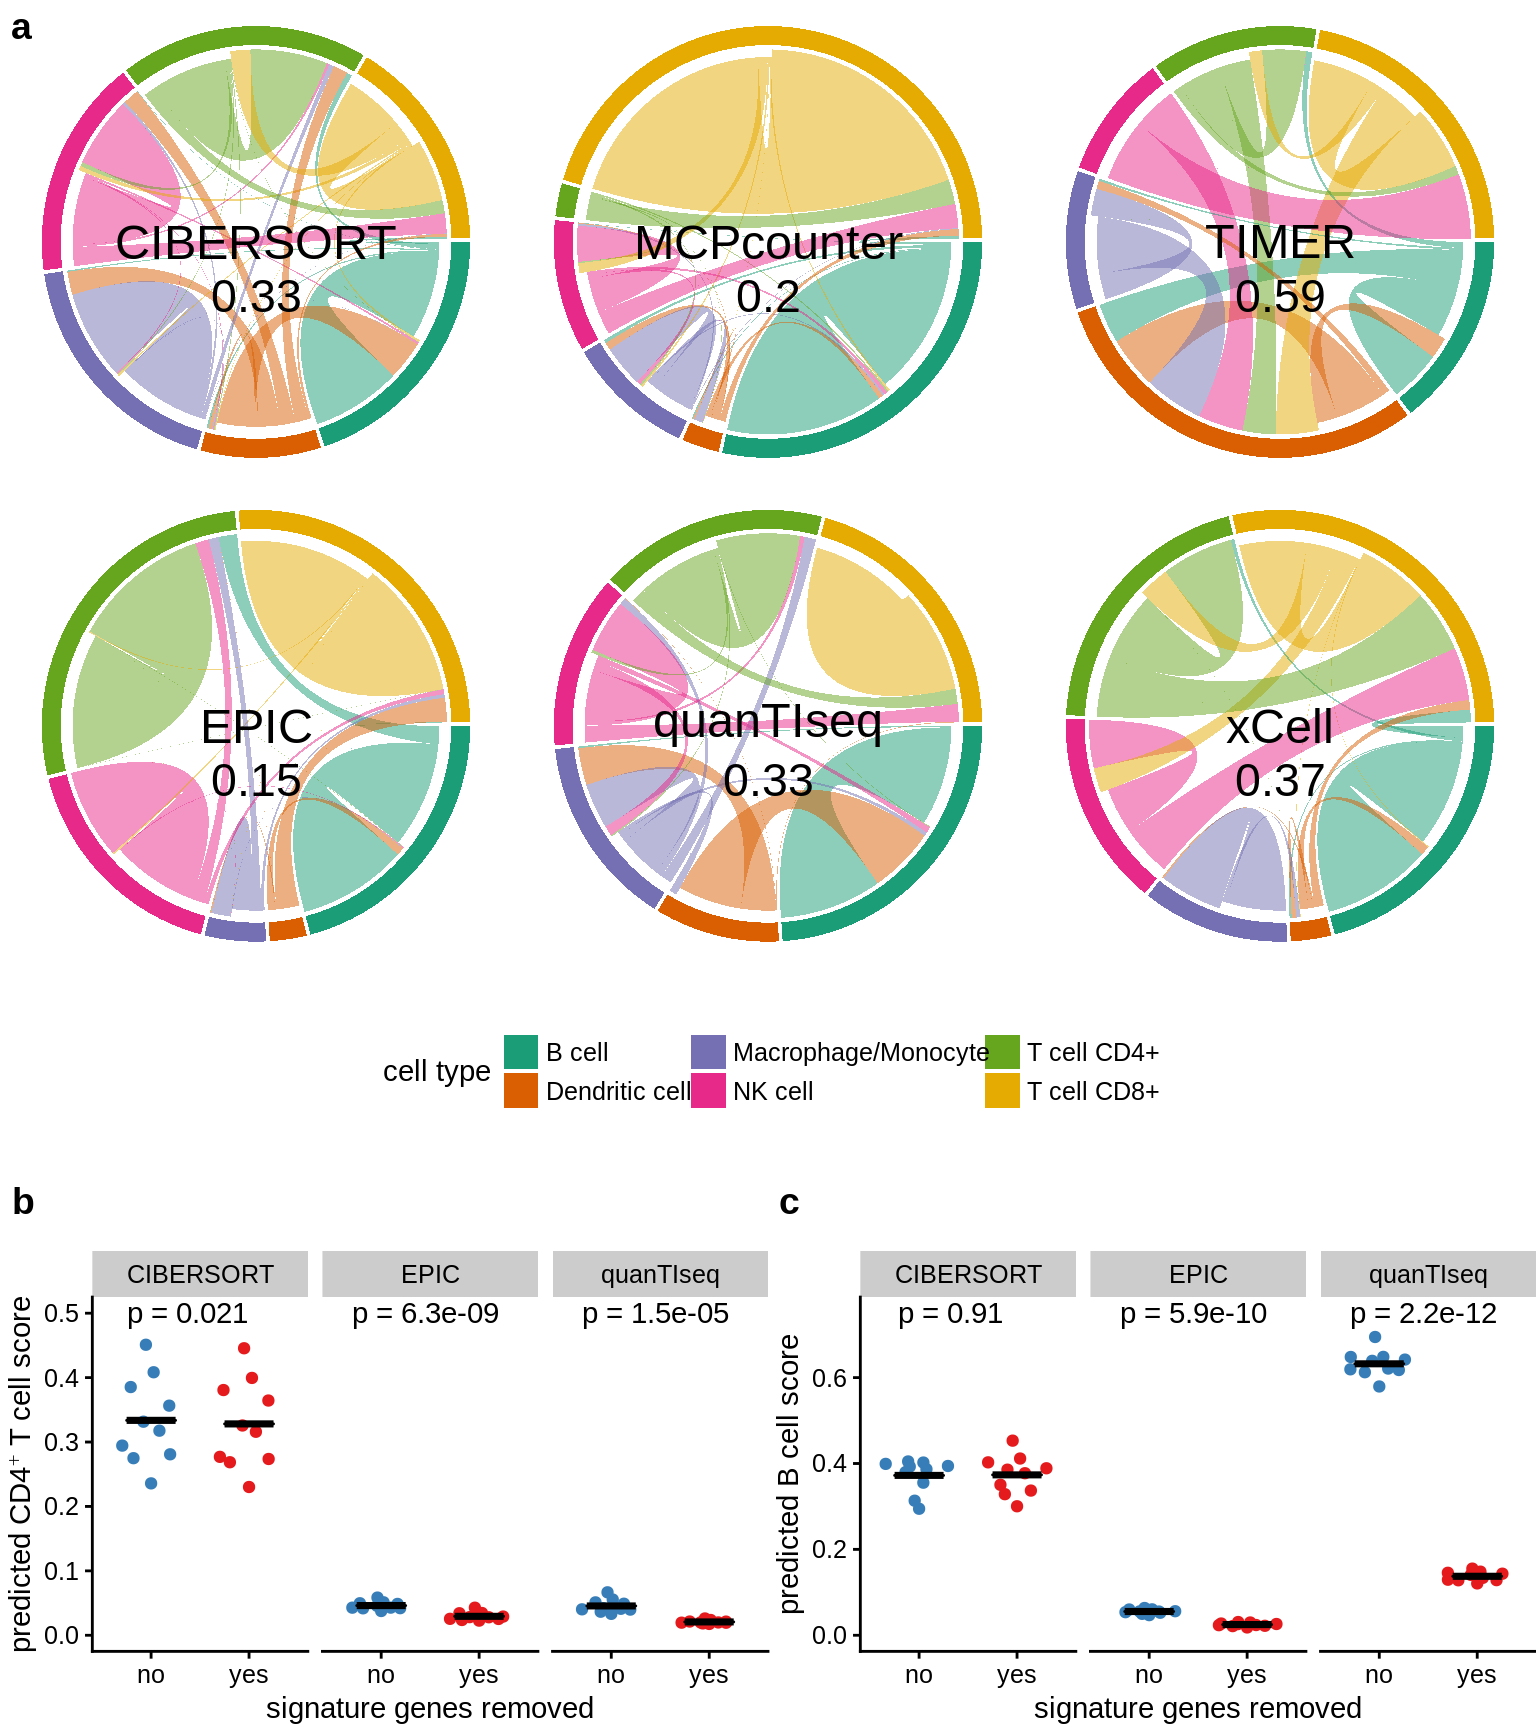
Figure 8.4: Migration chart figure for paper.
## Warning in grid.Call(C_textBounds, as.graphicsAnnot(x$label), x$x, x$y, :
## conversion failure on 'predicted CD4⁺ T cell score' in 'mbcsToSbcs': dot
## substituted for <e2>
## Warning in grid.Call(C_textBounds, as.graphicsAnnot(x$label), x$x, x$y, :
## conversion failure on 'predicted CD4⁺ T cell score' in 'mbcsToSbcs': dot
## substituted for <81>## Warning in grid.Call(C_textBounds, as.graphicsAnnot(x$label), x$x, x$y, :
## conversion failure on 'predicted CD4⁺ T cell score' in 'mbcsToSbcs': dot
## substituted for <ba>## Warning in grid.Call(C_textBounds, as.graphicsAnnot(x$label), x$x, x$y, :
## conversion failure on 'predicted CD4⁺ T cell score' in 'mbcsToSbcs': dot
## substituted for <e2>## Warning in grid.Call(C_textBounds, as.graphicsAnnot(x$label), x$x, x$y, :
## conversion failure on 'predicted CD4⁺ T cell score' in 'mbcsToSbcs': dot
## substituted for <81>## Warning in grid.Call(C_textBounds, as.graphicsAnnot(x$label), x$x, x$y, :
## conversion failure on 'predicted CD4⁺ T cell score' in 'mbcsToSbcs': dot
## substituted for <ba>## Warning in grid.Call.graphics(C_text, as.graphicsAnnot(x$label), x$x,
## x$y, : conversion failure on 'predicted CD4⁺ T cell score' in 'mbcsToSbcs':
## dot substituted for <e2>## Warning in grid.Call.graphics(C_text, as.graphicsAnnot(x$label), x$x,
## x$y, : conversion failure on 'predicted CD4⁺ T cell score' in 'mbcsToSbcs':
## dot substituted for <81>## Warning in grid.Call.graphics(C_text, as.graphicsAnnot(x$label), x$x,
## x$y, : conversion failure on 'predicted CD4⁺ T cell score' in 'mbcsToSbcs':
## dot substituted for <ba>## Warning in grid.Call.graphics(C_text, as.graphicsAnnot(x$label), x$x,
## x$y, : conversion failure on 'predicted CD4⁺ T cell score' in 'mbcsToSbcs':
## dot substituted for <e2>## Warning in grid.Call.graphics(C_text, as.graphicsAnnot(x$label), x$x,
## x$y, : conversion failure on 'predicted CD4⁺ T cell score' in 'mbcsToSbcs':
## dot substituted for <81>## Warning in grid.Call.graphics(C_text, as.graphicsAnnot(x$label), x$x,
## x$y, : conversion failure on 'predicted CD4⁺ T cell score' in 'mbcsToSbcs':
## dot substituted for <ba>