6 Detection limit and false positive predictions
How many cells of a certain type do we need for a method to detect immune cell infiltration (=Detection limit)? How many cells of a certain type are detected, although we know they are not there (=false positives)?
We again use the single cell dataset to simulate samples that consist of background cells (i.e. non-immune cells: fibroblasts, endothelial cells cancer cells) and add an increasing amount of immune cells of a certain type.
We define the detection limit as the minimal fraction at which the method the abundance of the cell type to be significantly different from zero. We define false positives as the predicted fraction of a certain cell type at zero inflitration level.
For each amount of immune cells, we generate 5 random samples to compute a confidence interval.
We use the following cell types:
show_cell_types = c("B cell", "Dendritic cell", "Macrophage/Monocyte",
                    "NK cell", "T cell CD4+", "T cell CD8+",
                    "T cell CD4+ (non-regulatory)", "T cell regulatory (Tregs)")
6.1 Predictions with increasing immune cell content
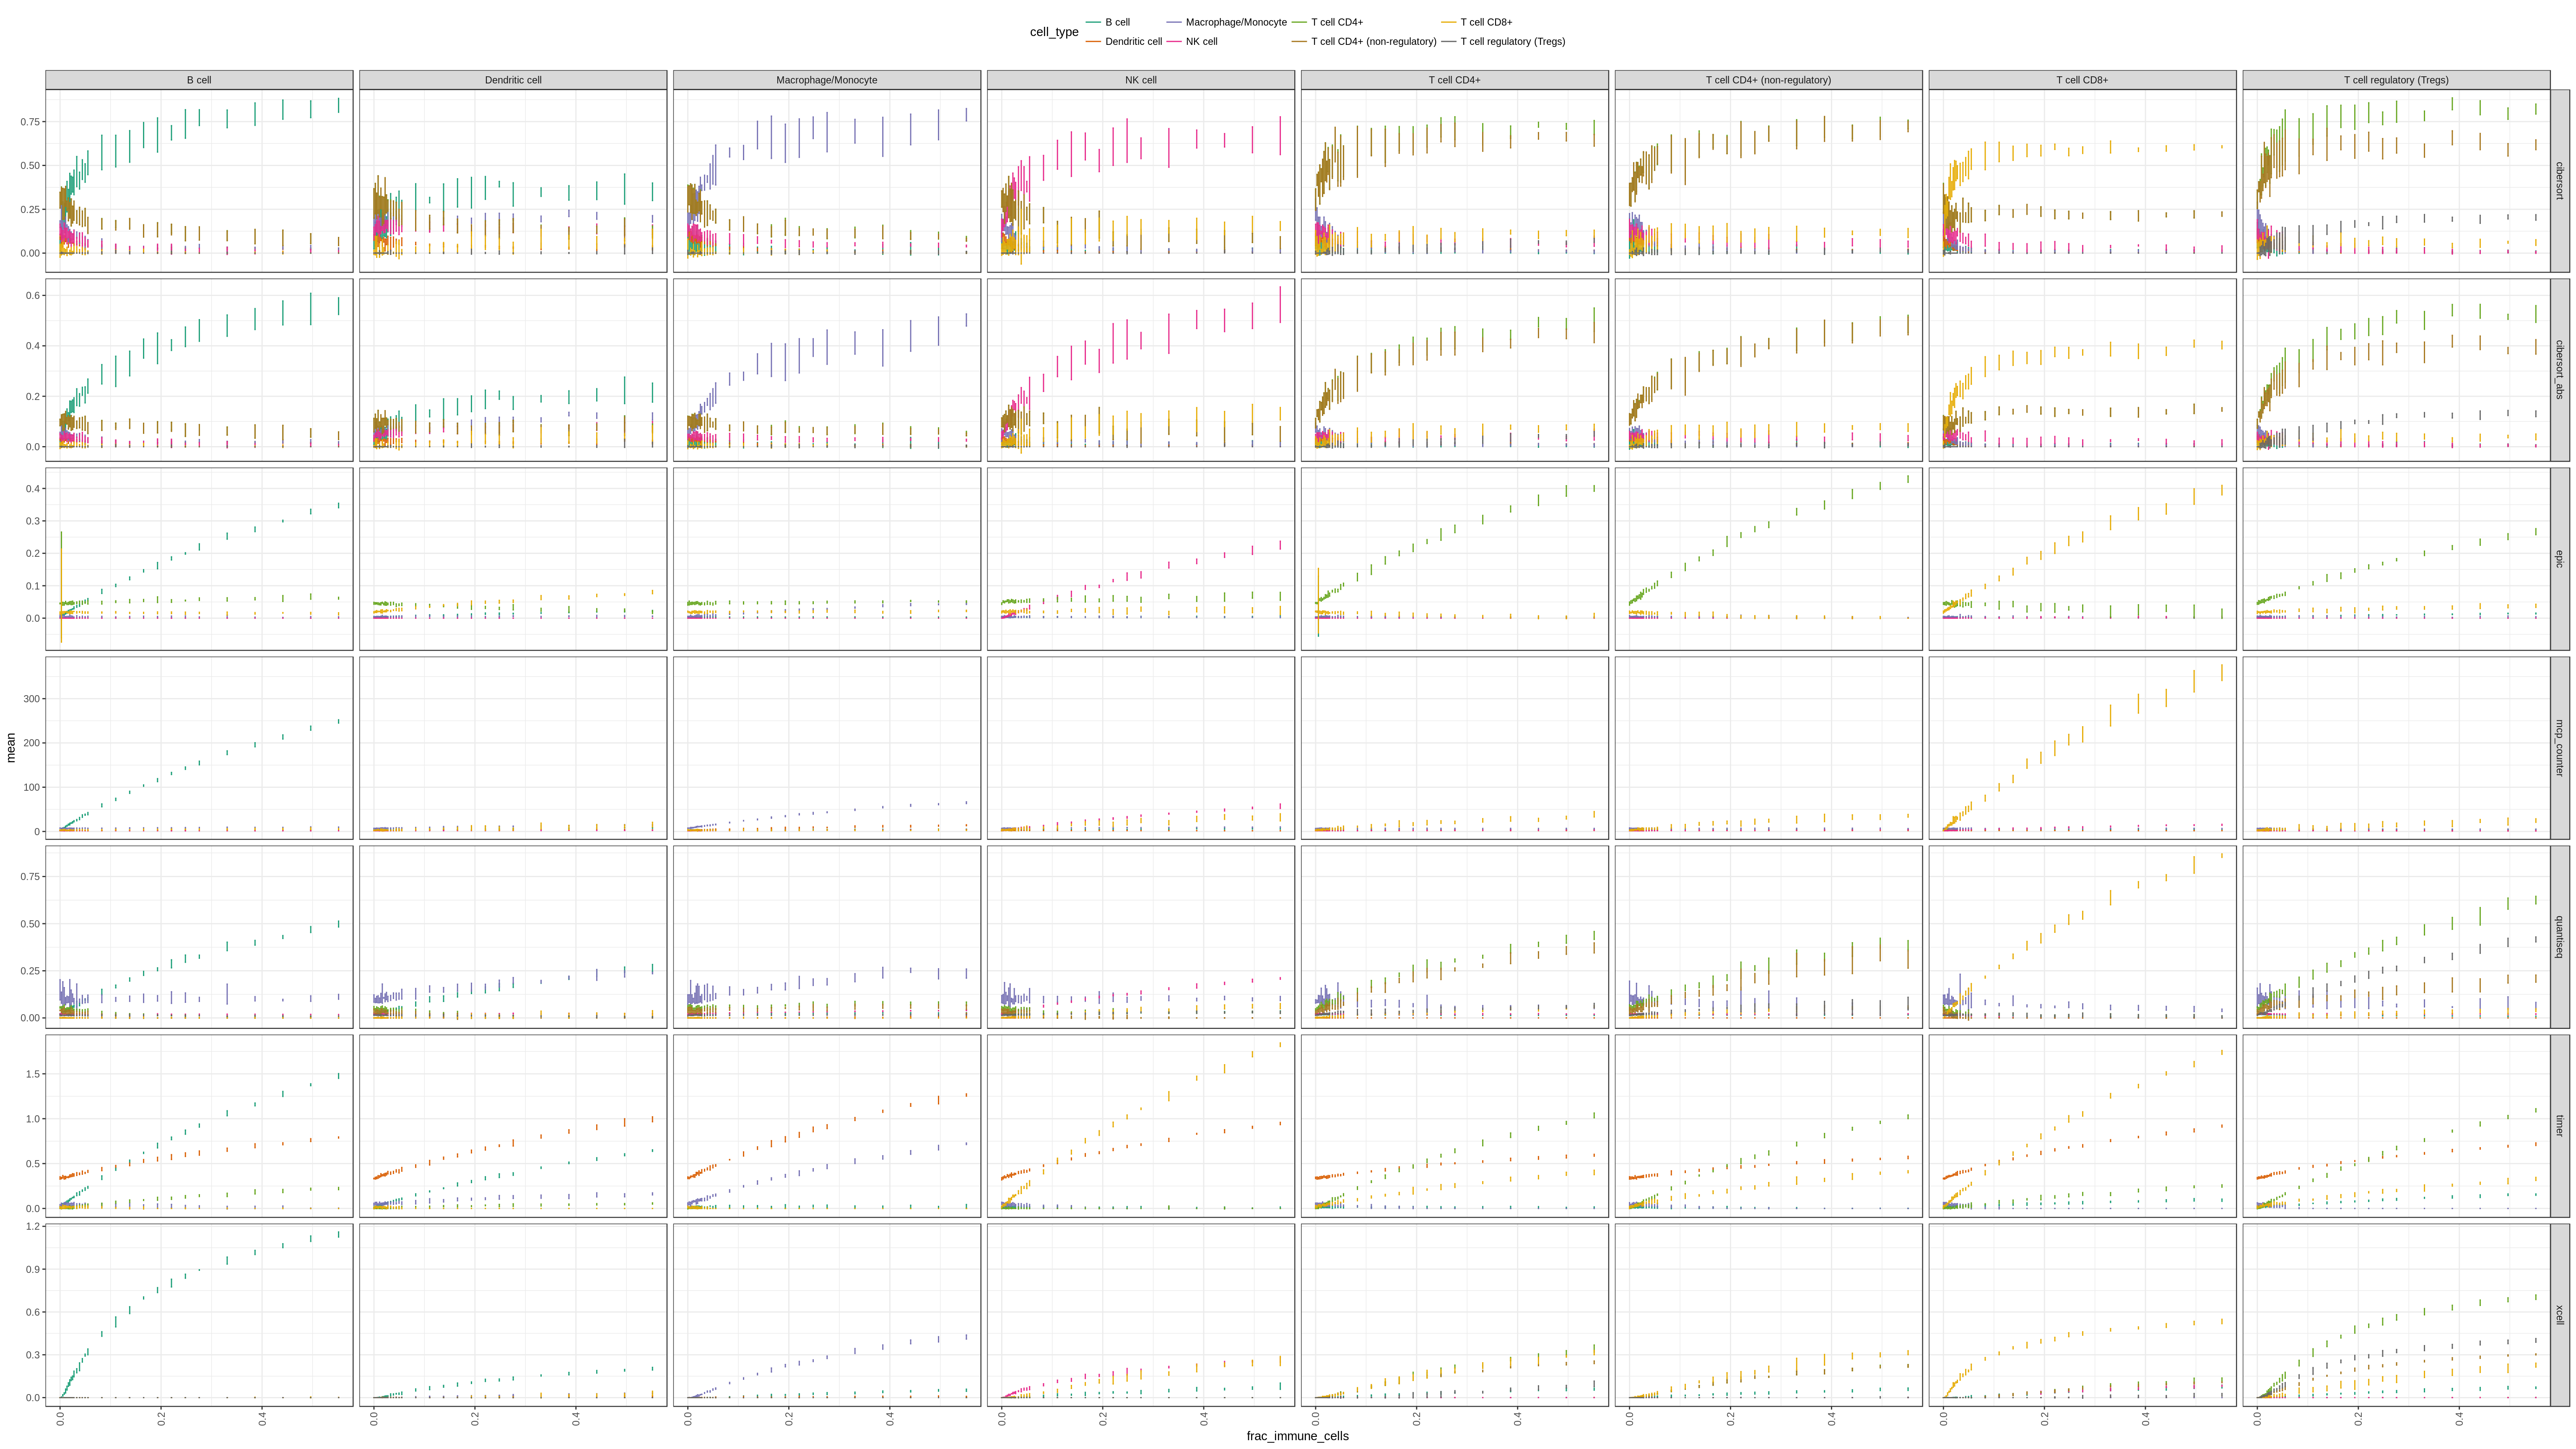
Figure 6.1: We add an increasing amount of each cell type independently to the 1,800 background cells. The figure shows the predictions for each cell type and method at increasing infiltration levels. Tip: right-click, ‘open in new tab’ to enlarge!
6.2 Detection Limit and False positives
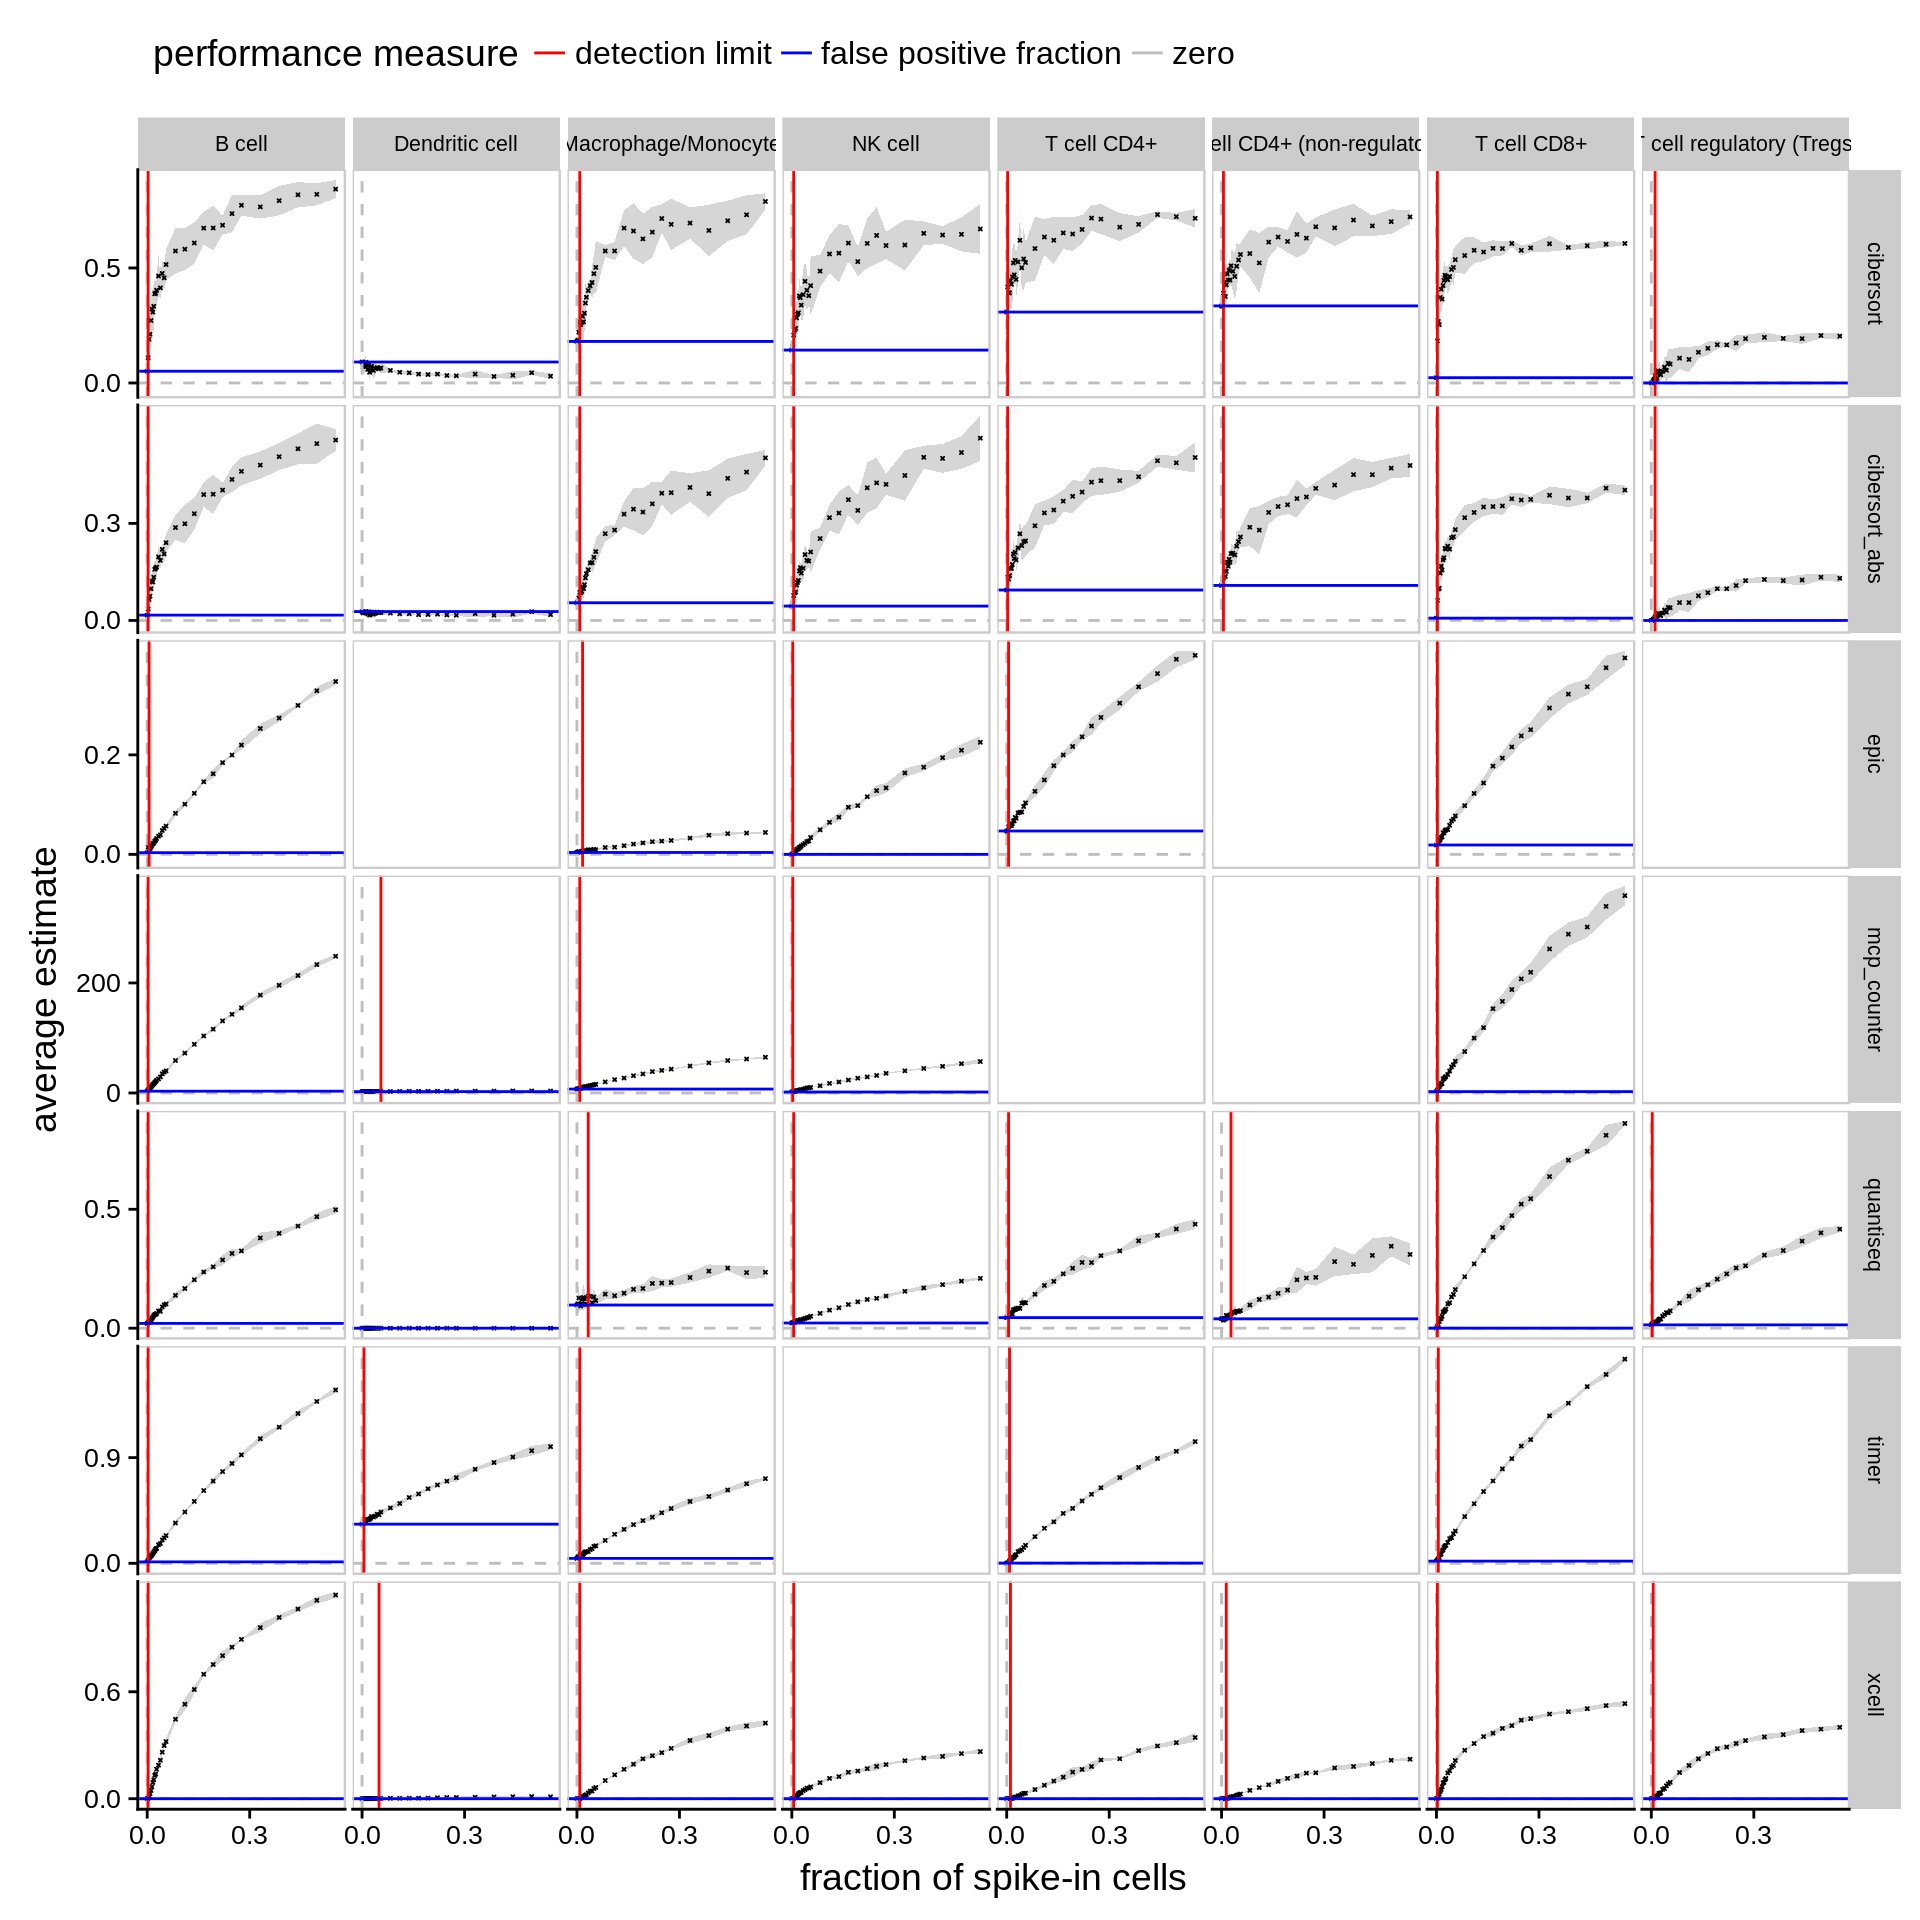
Figure 6.2: Detection limit and false positive predictions. The plots show the average estimate of each method for five simulated bulk RNA-seq datasets randomly sampled from ~1,800 non-immune cells and an increasing fraction of a specific immune cell type. The grey ribbon indicates the standard deviation. The red line refers to the detection limit, i.e. the minimal fraction of an immune cell type needed for a method to reliably detect its abundance as significantly different from zero (p-value < 0.05, two-sided t-test). The blue line refers to the false-positive prediction rate, i.e. the average estimate of a method with no immune cells present.
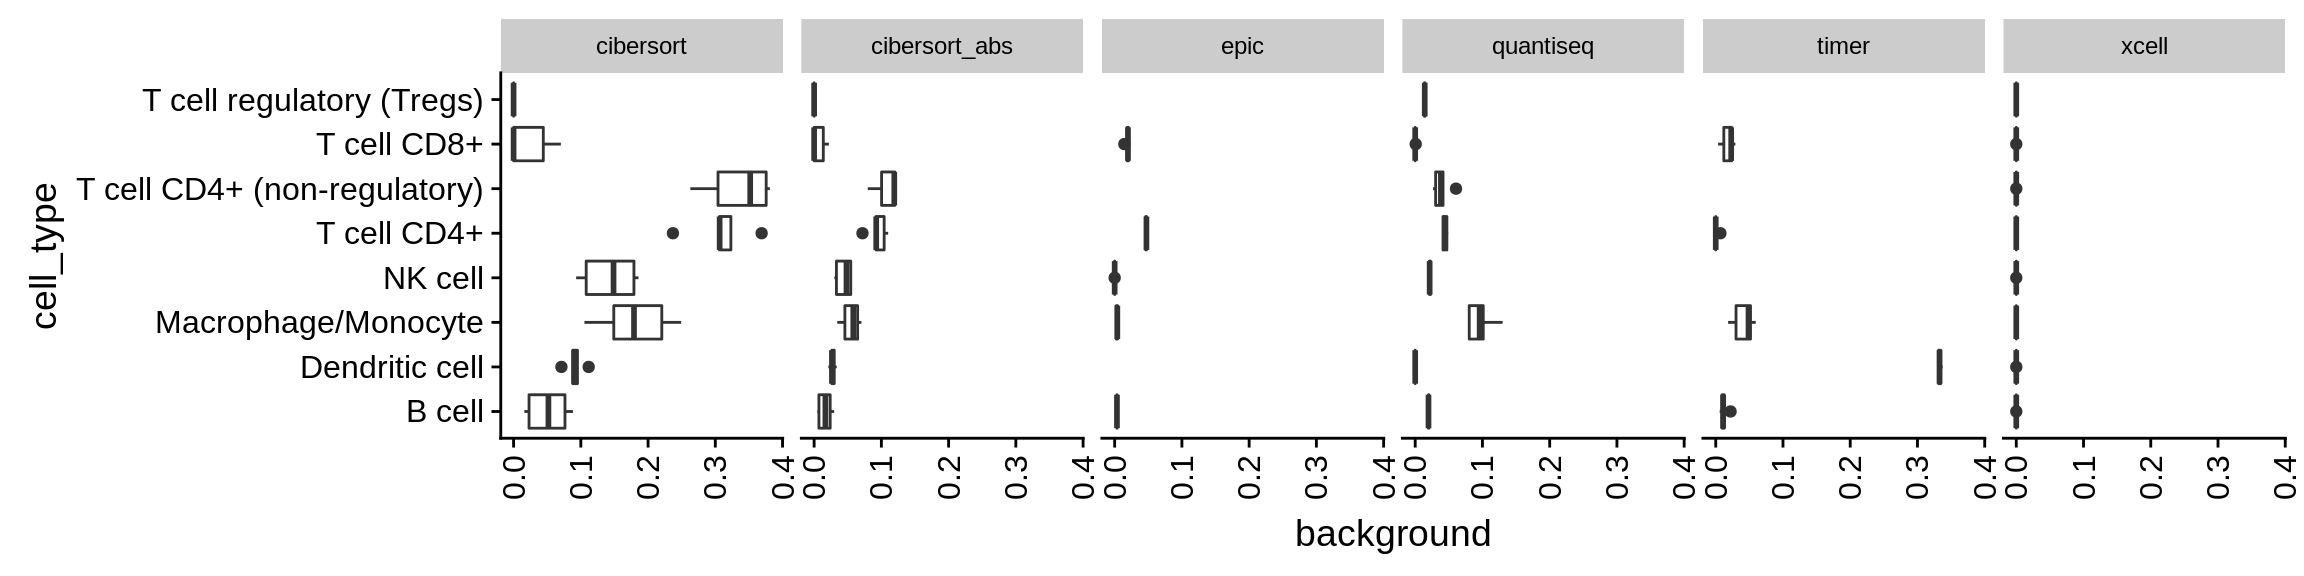
Figure 6.3: Predicted amount of a certain cell type while it is actually absent. This analysis is based on all of the data above where only background cells are present, i.e. fraction of immune cells = 0.