5 Validation with real data
We use datasets which estimate the immune cell proportions using flow cytometry as an additional validation for our simulation benchmark. We use the following three validation datasets (see section 2):
We use the following cell types, which are available in (some of) the datasets
use_cell_types = c("T cell", "T cell CD8+", "T cell CD4+",
                   "Monocyte", "B cell",
                   "Dendritic cell", "NK cell")
Here, we combine the predictions with the ‘gold standard’ reference data.
all_results_ref = inner_join(all_results, all_refs,
                             by = c("sample" = "sample",
                                    "dataset" = "dataset",
                                    "cell_type" = "cell_type"))

res_validation$all_results = all_results_ref
The scores of the methods have different properties and not all of them are directly comparable. We distinguish between three types of comparisons:
- absolute scores: allow to compare within and between samples.
- scores relative to the total immune cell content: allow to compare within a sample
- scores in arbitrary units, that only allow to compare between samples.
5.1 Between- and within-sample comparisons
Only works for methods providing an absolute score (cibersort_abs, quantiseq, epic). All other methods are included for reference.
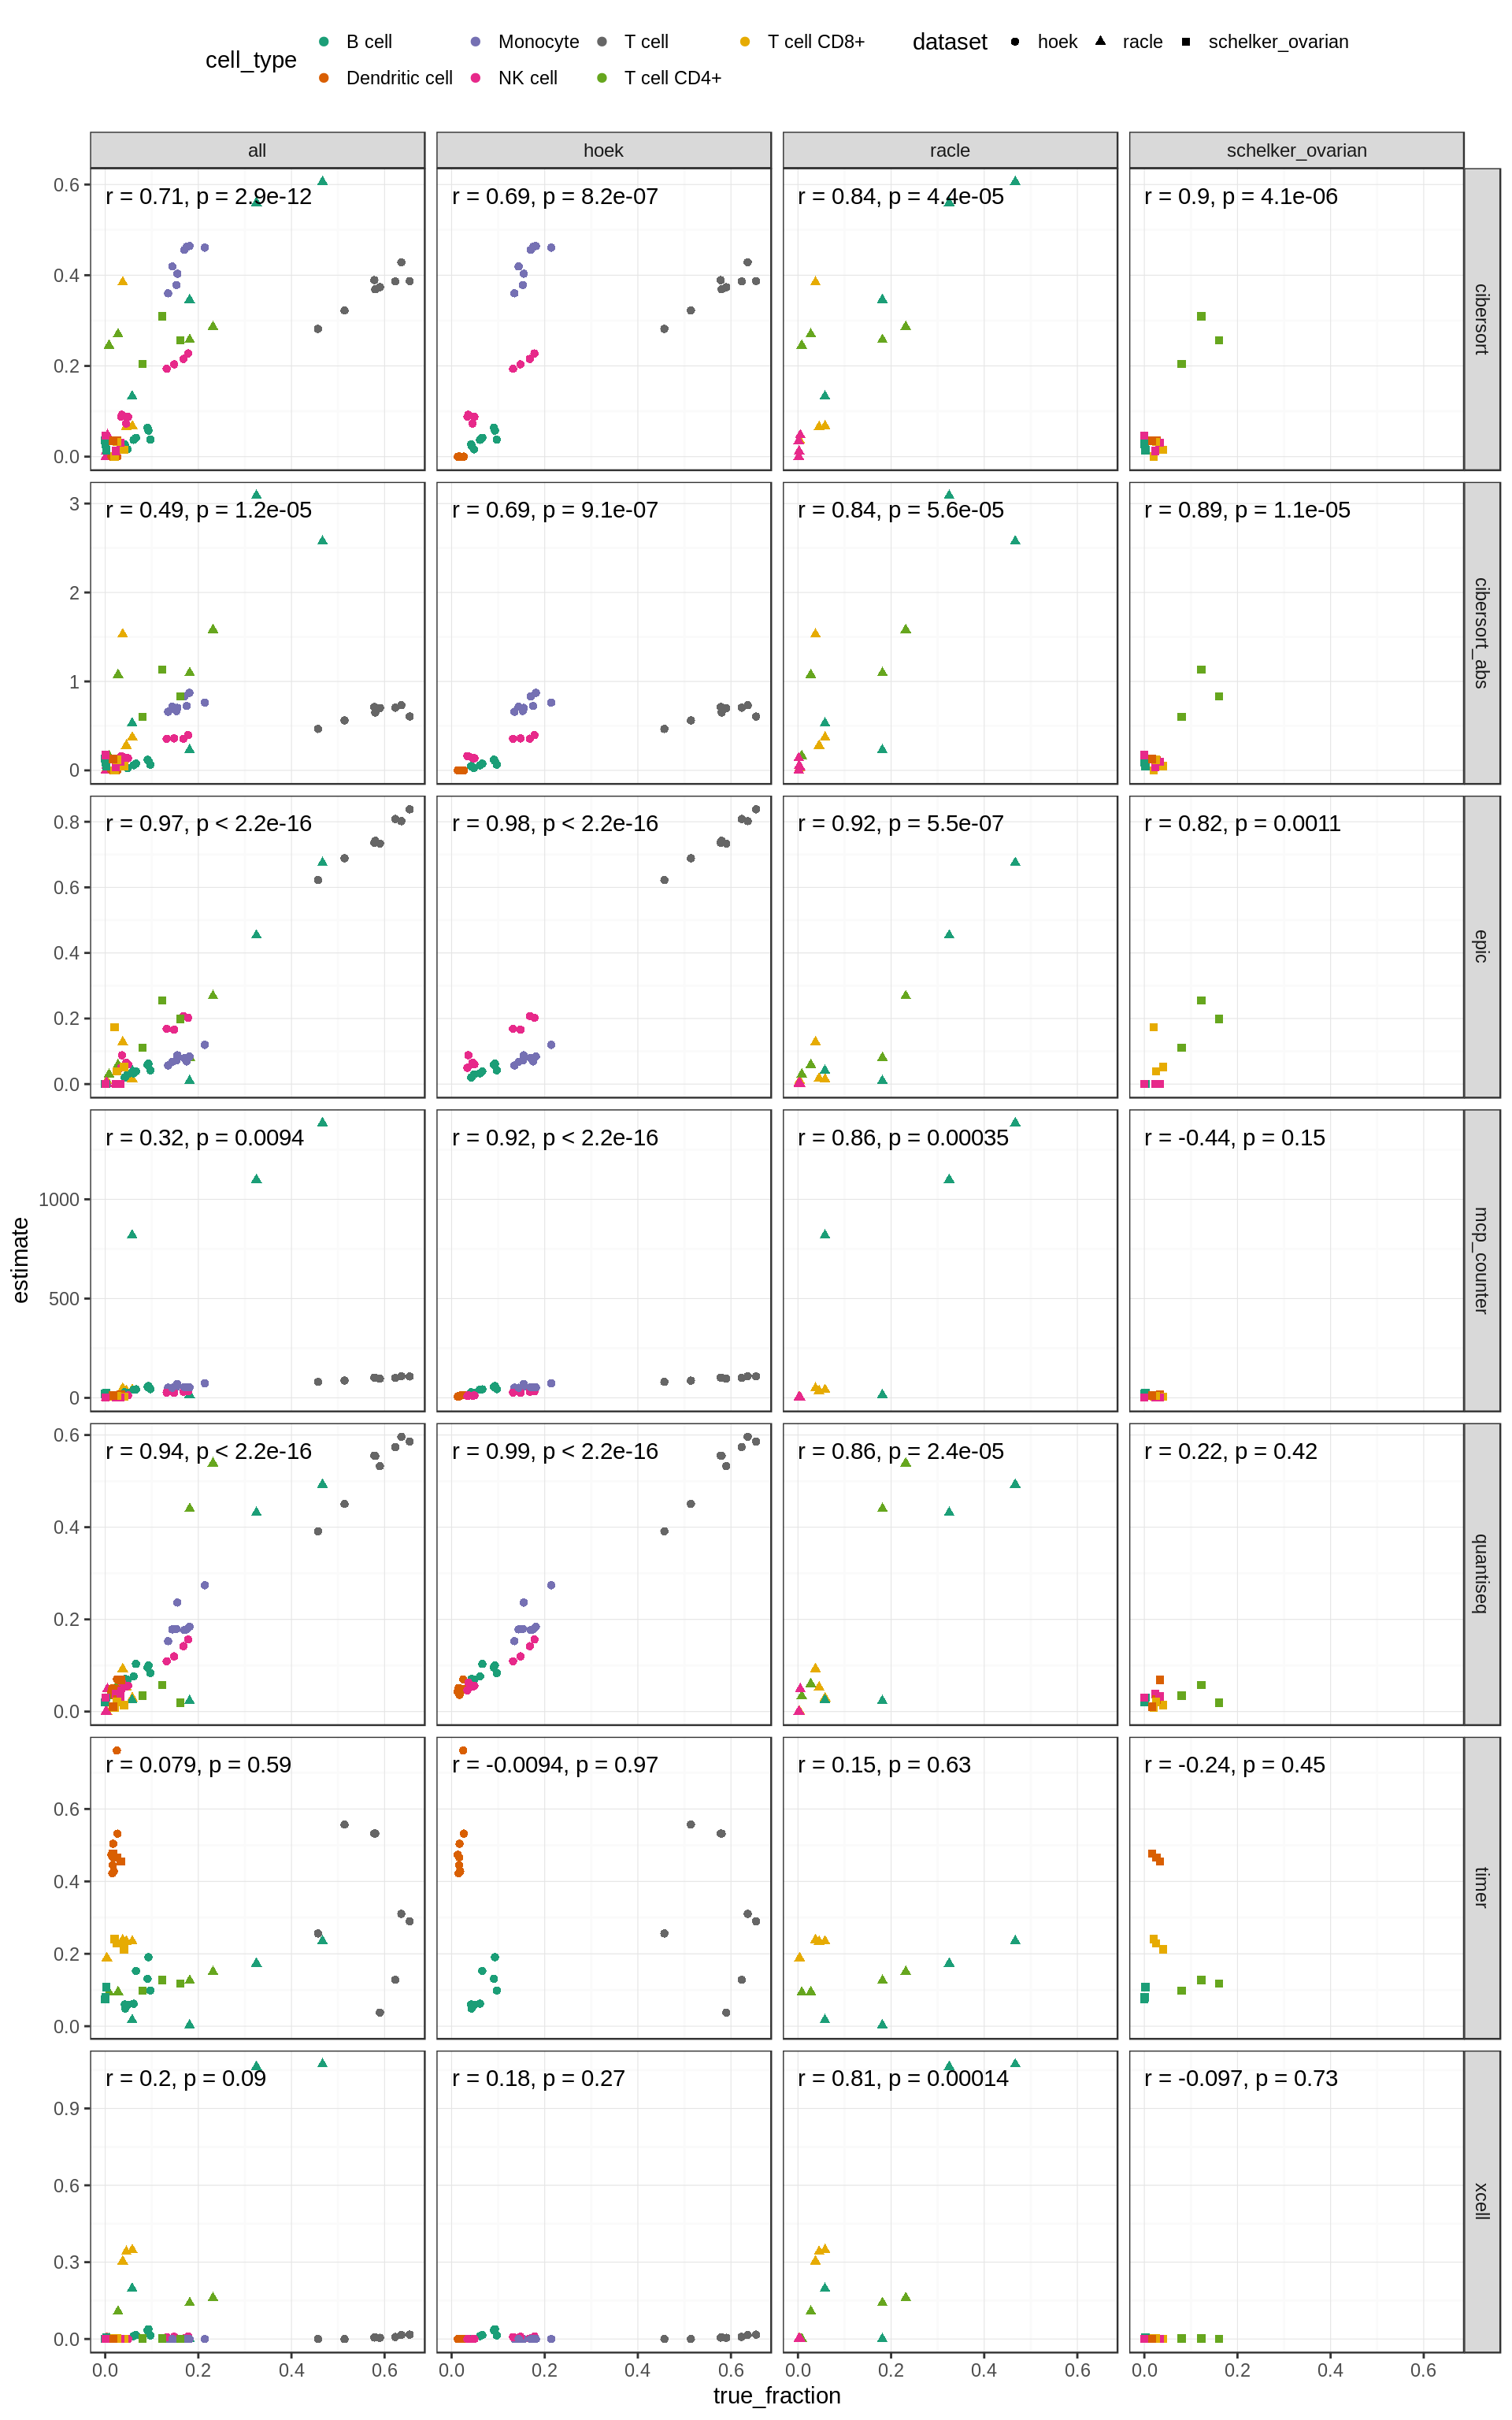
Figure 5.1: Comparison of absolute predictions for three validation dataset.
5.1.1 Absolute scores
Both EPIC and quanTIseq provide scores that can be interpreted as absolute cell fractions. Both methods account for the different mRNA contents of the different cell types by applying a scaling factor. As the expression values of the single cells we use for the simulation have already been normalized, these scaling factors are not appropriate. While this has no effect on the correlations discussed in the previous section, it is crucial for deriving correct absolute values. For this reason, assessing the absolute quantification performance is fair on the validation datasets only, which provide geniune bulk RNA-seq data.
We use two measures to assess the absolute deviation: (1) the slope of a linear model fitted to the estimated versus known fractions and (2) the root mean square error (RMSE). The slope quickly allows to evaluate whether a method over- or under-predicts a certain cell type while RMSE gives insight about the true deviations.
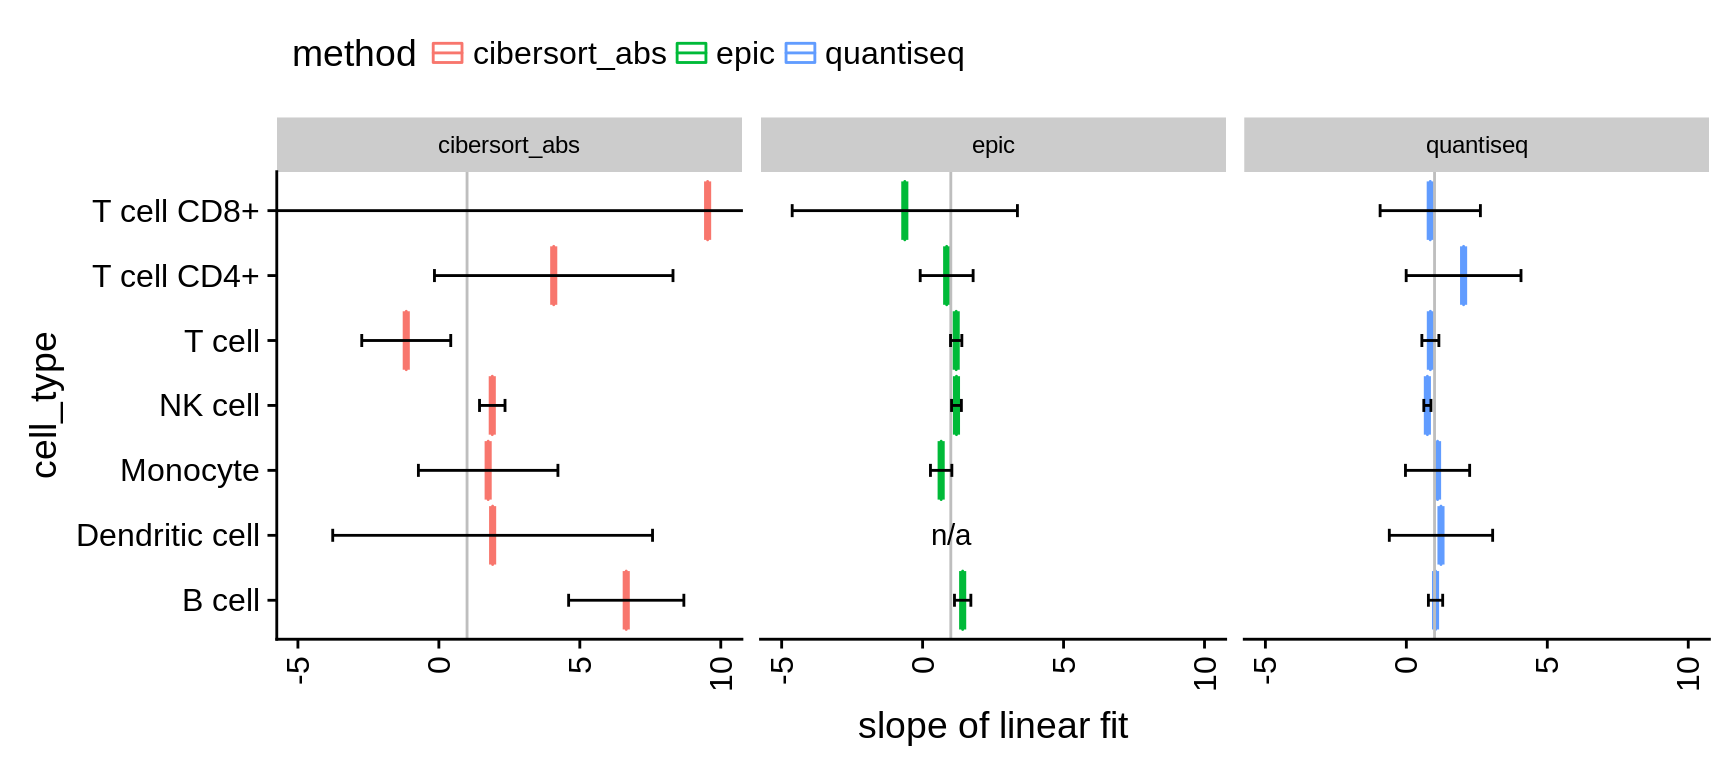
Figure 5.2: Comparison of absolute methods. Values indicate the slope of a linear model fitted to predictions vs. true fractions. Values < 1 indicate an under-prediction of the cell type, values > 1 an over-prediction respectively. The error bars have been computed using confint on the result of lm.
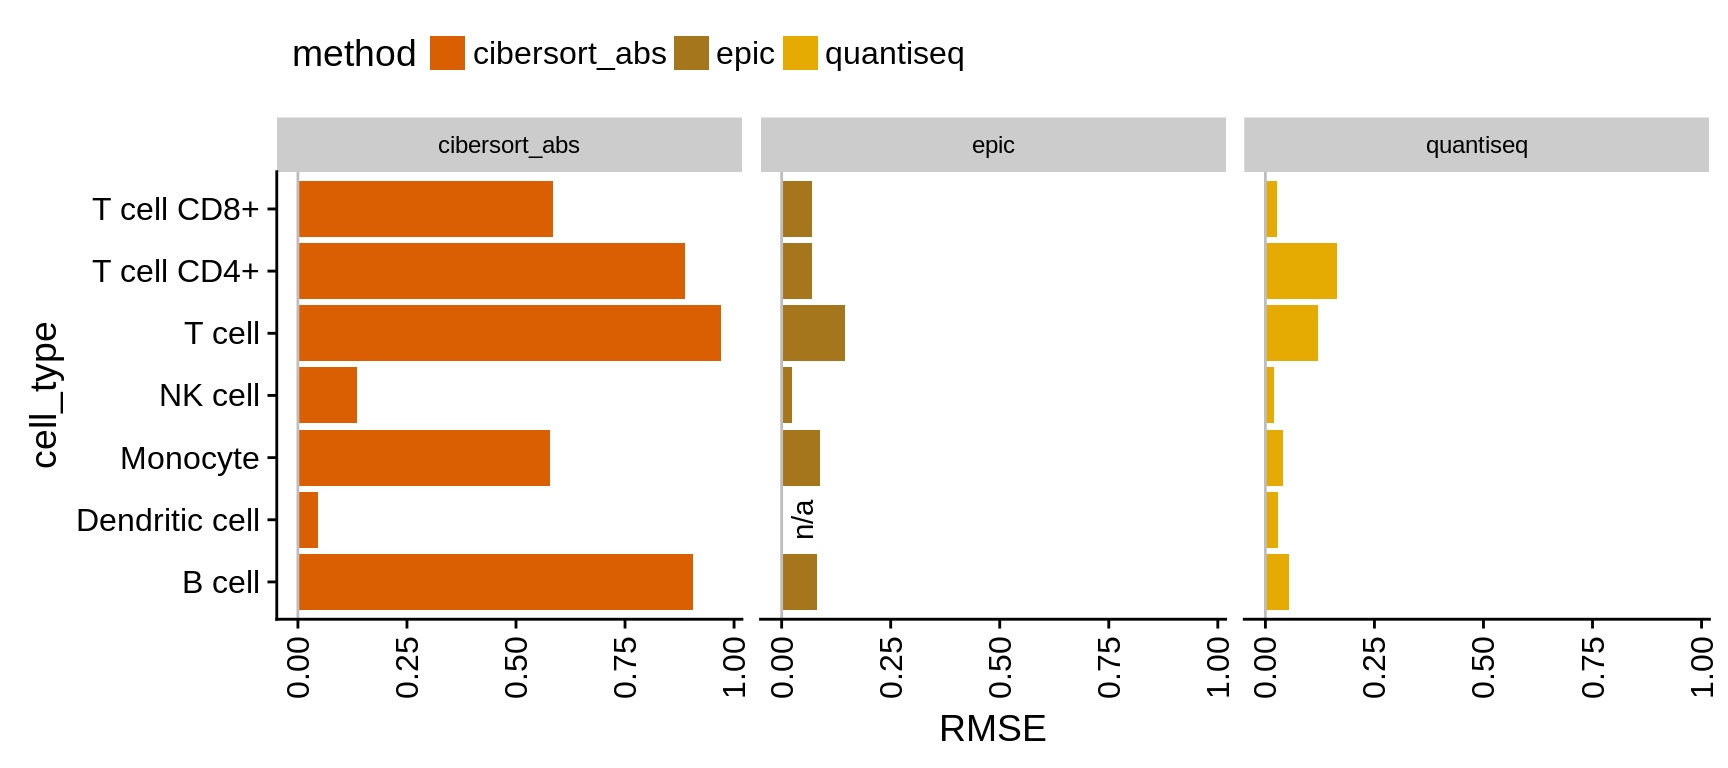
Figure 5.3: Comparison of absolute methods. The values show the RMSE
5.2 Within-sample comparison
only works with methods that provide an absolute score, or a score that is relative to total immune cell content (cibersort, cibersort_abs, quantiseq, epic).
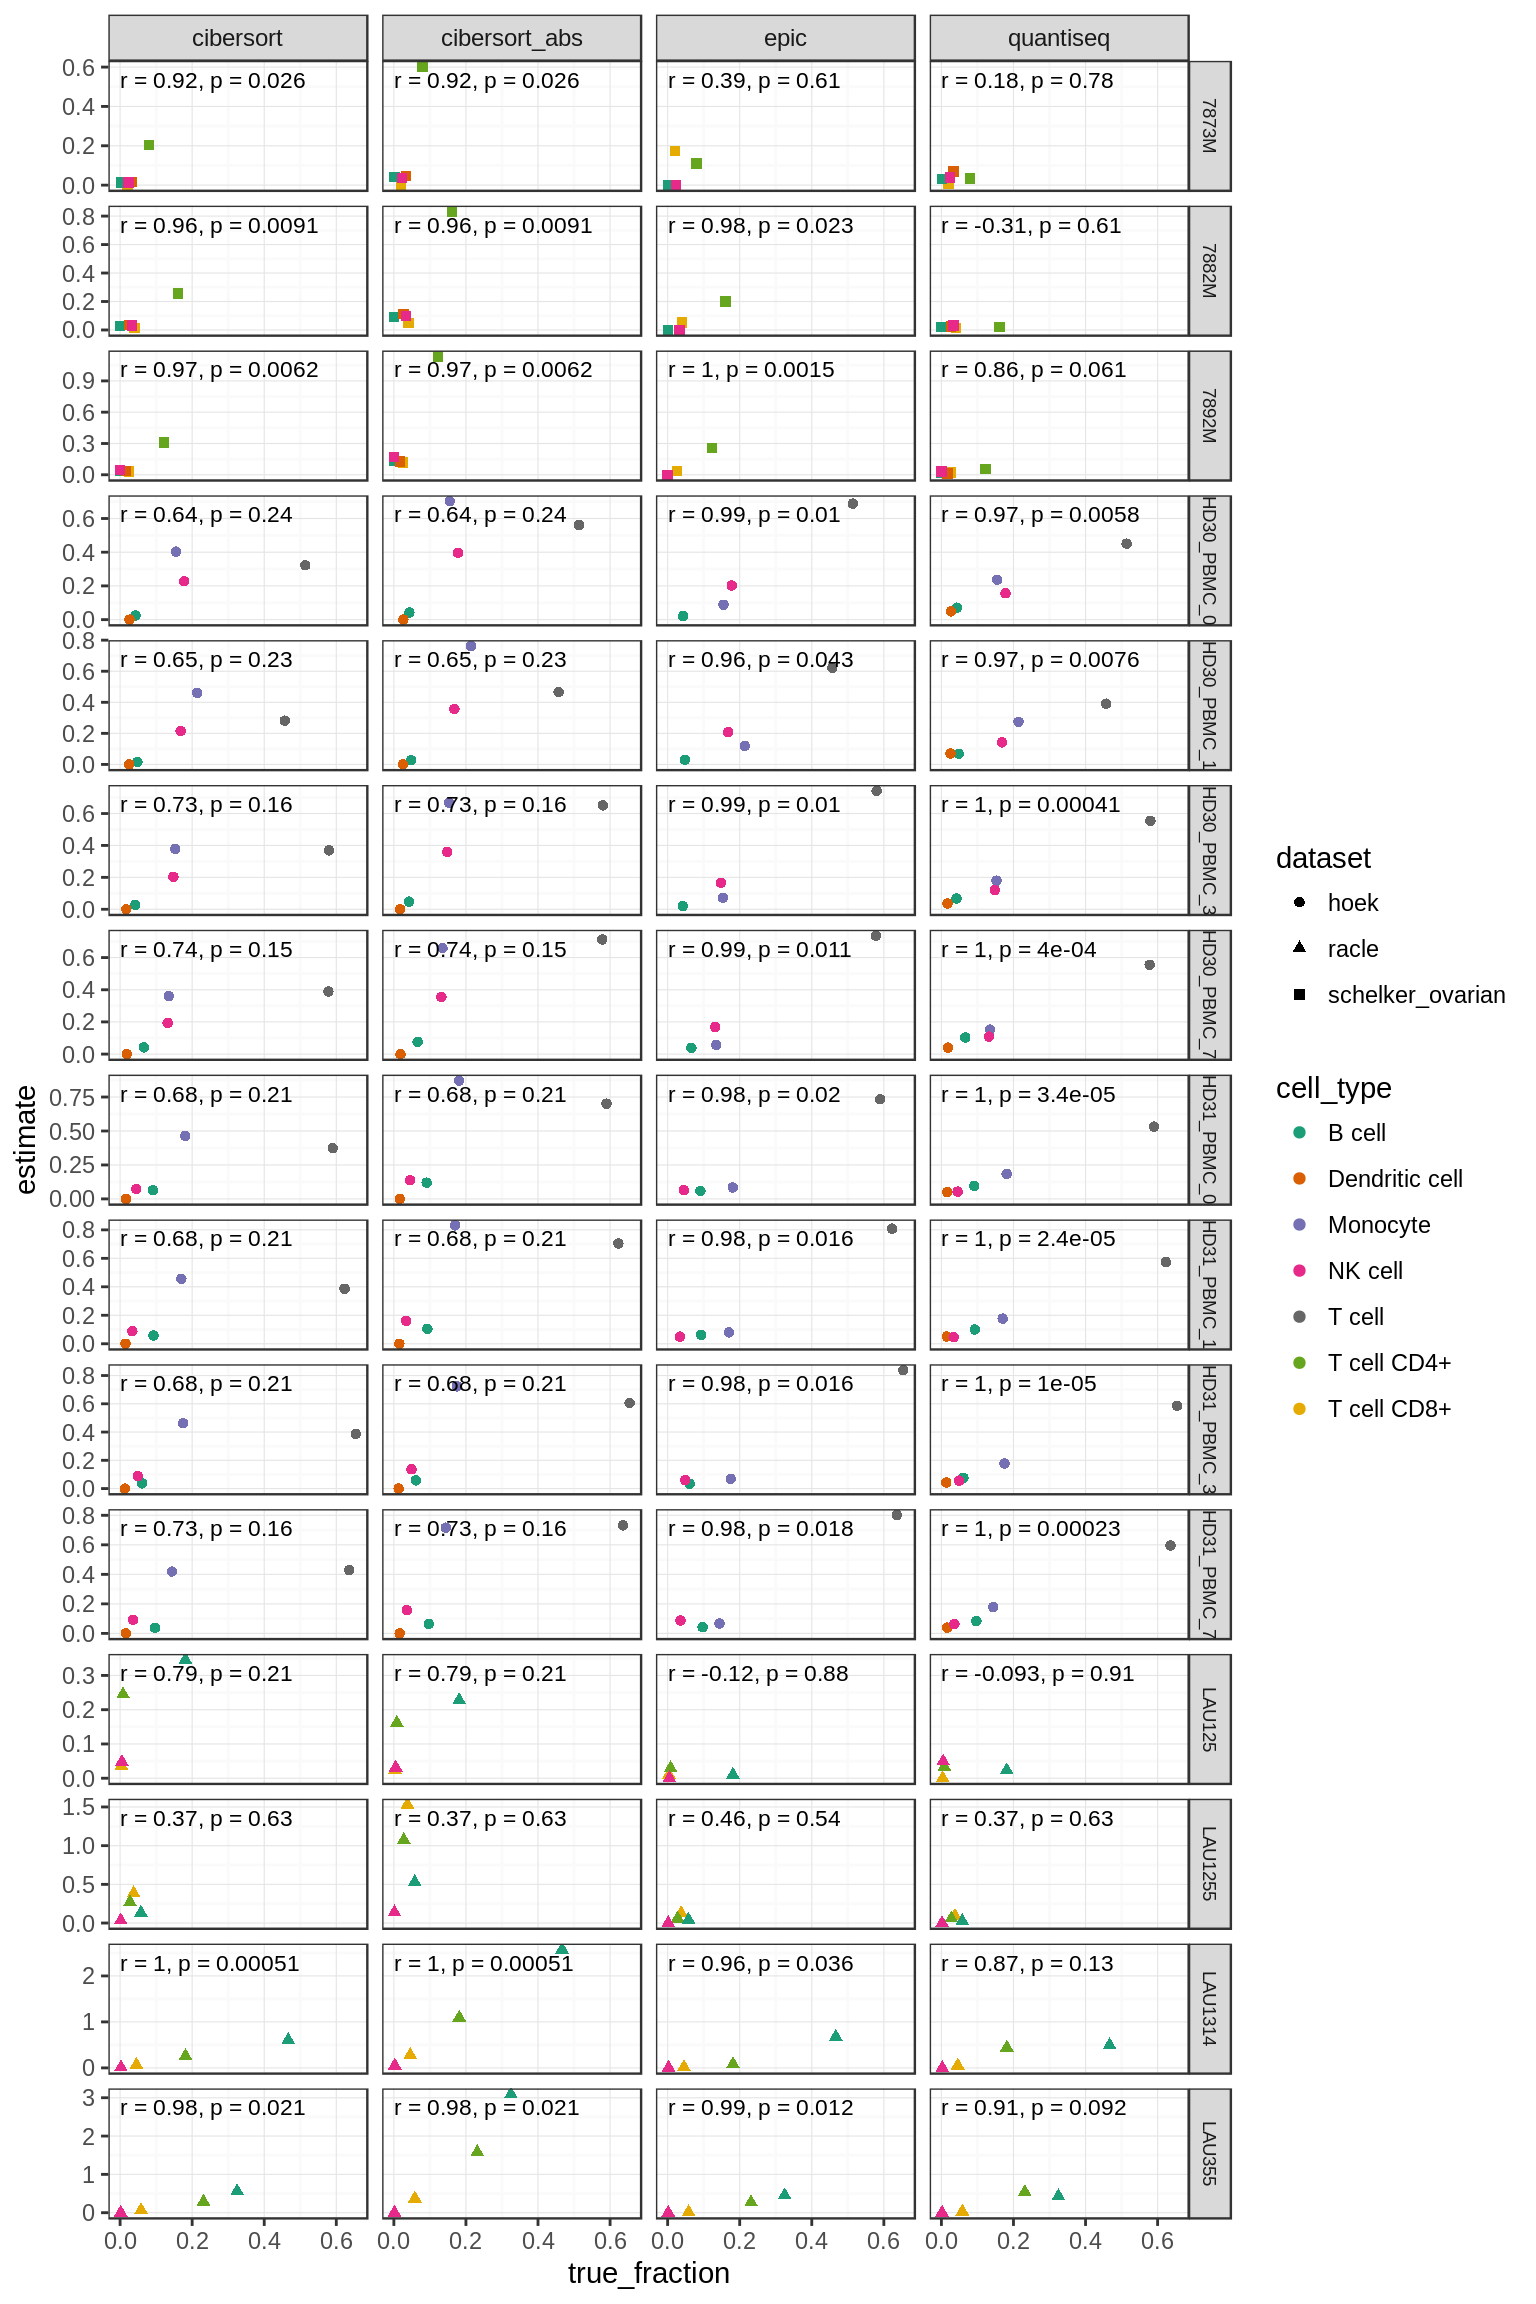
Figure 5.4: Comparison of predictions within each individual sample
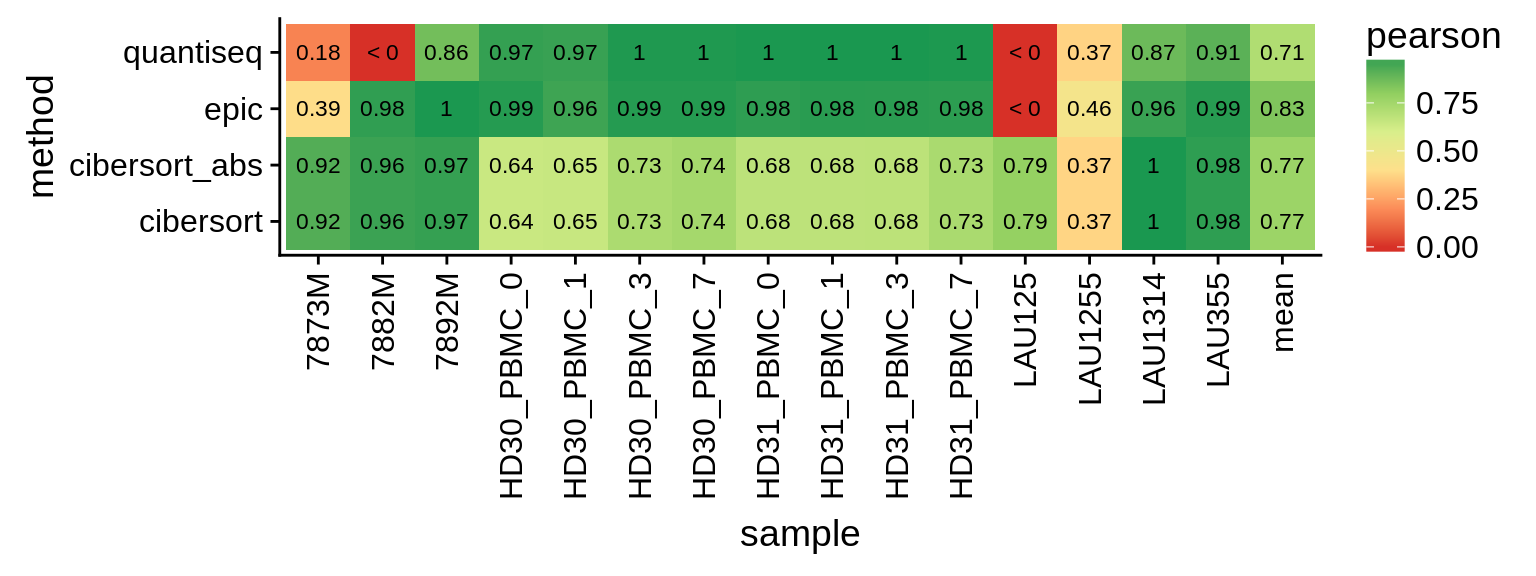
Figure 5.5: Correlations of within-sample comparisons. The last column shows the mean over all samples.
5.3 Between-sample comparisons
For this, we need to look at every cell type independently. Works for all methods except CIBERSORT.
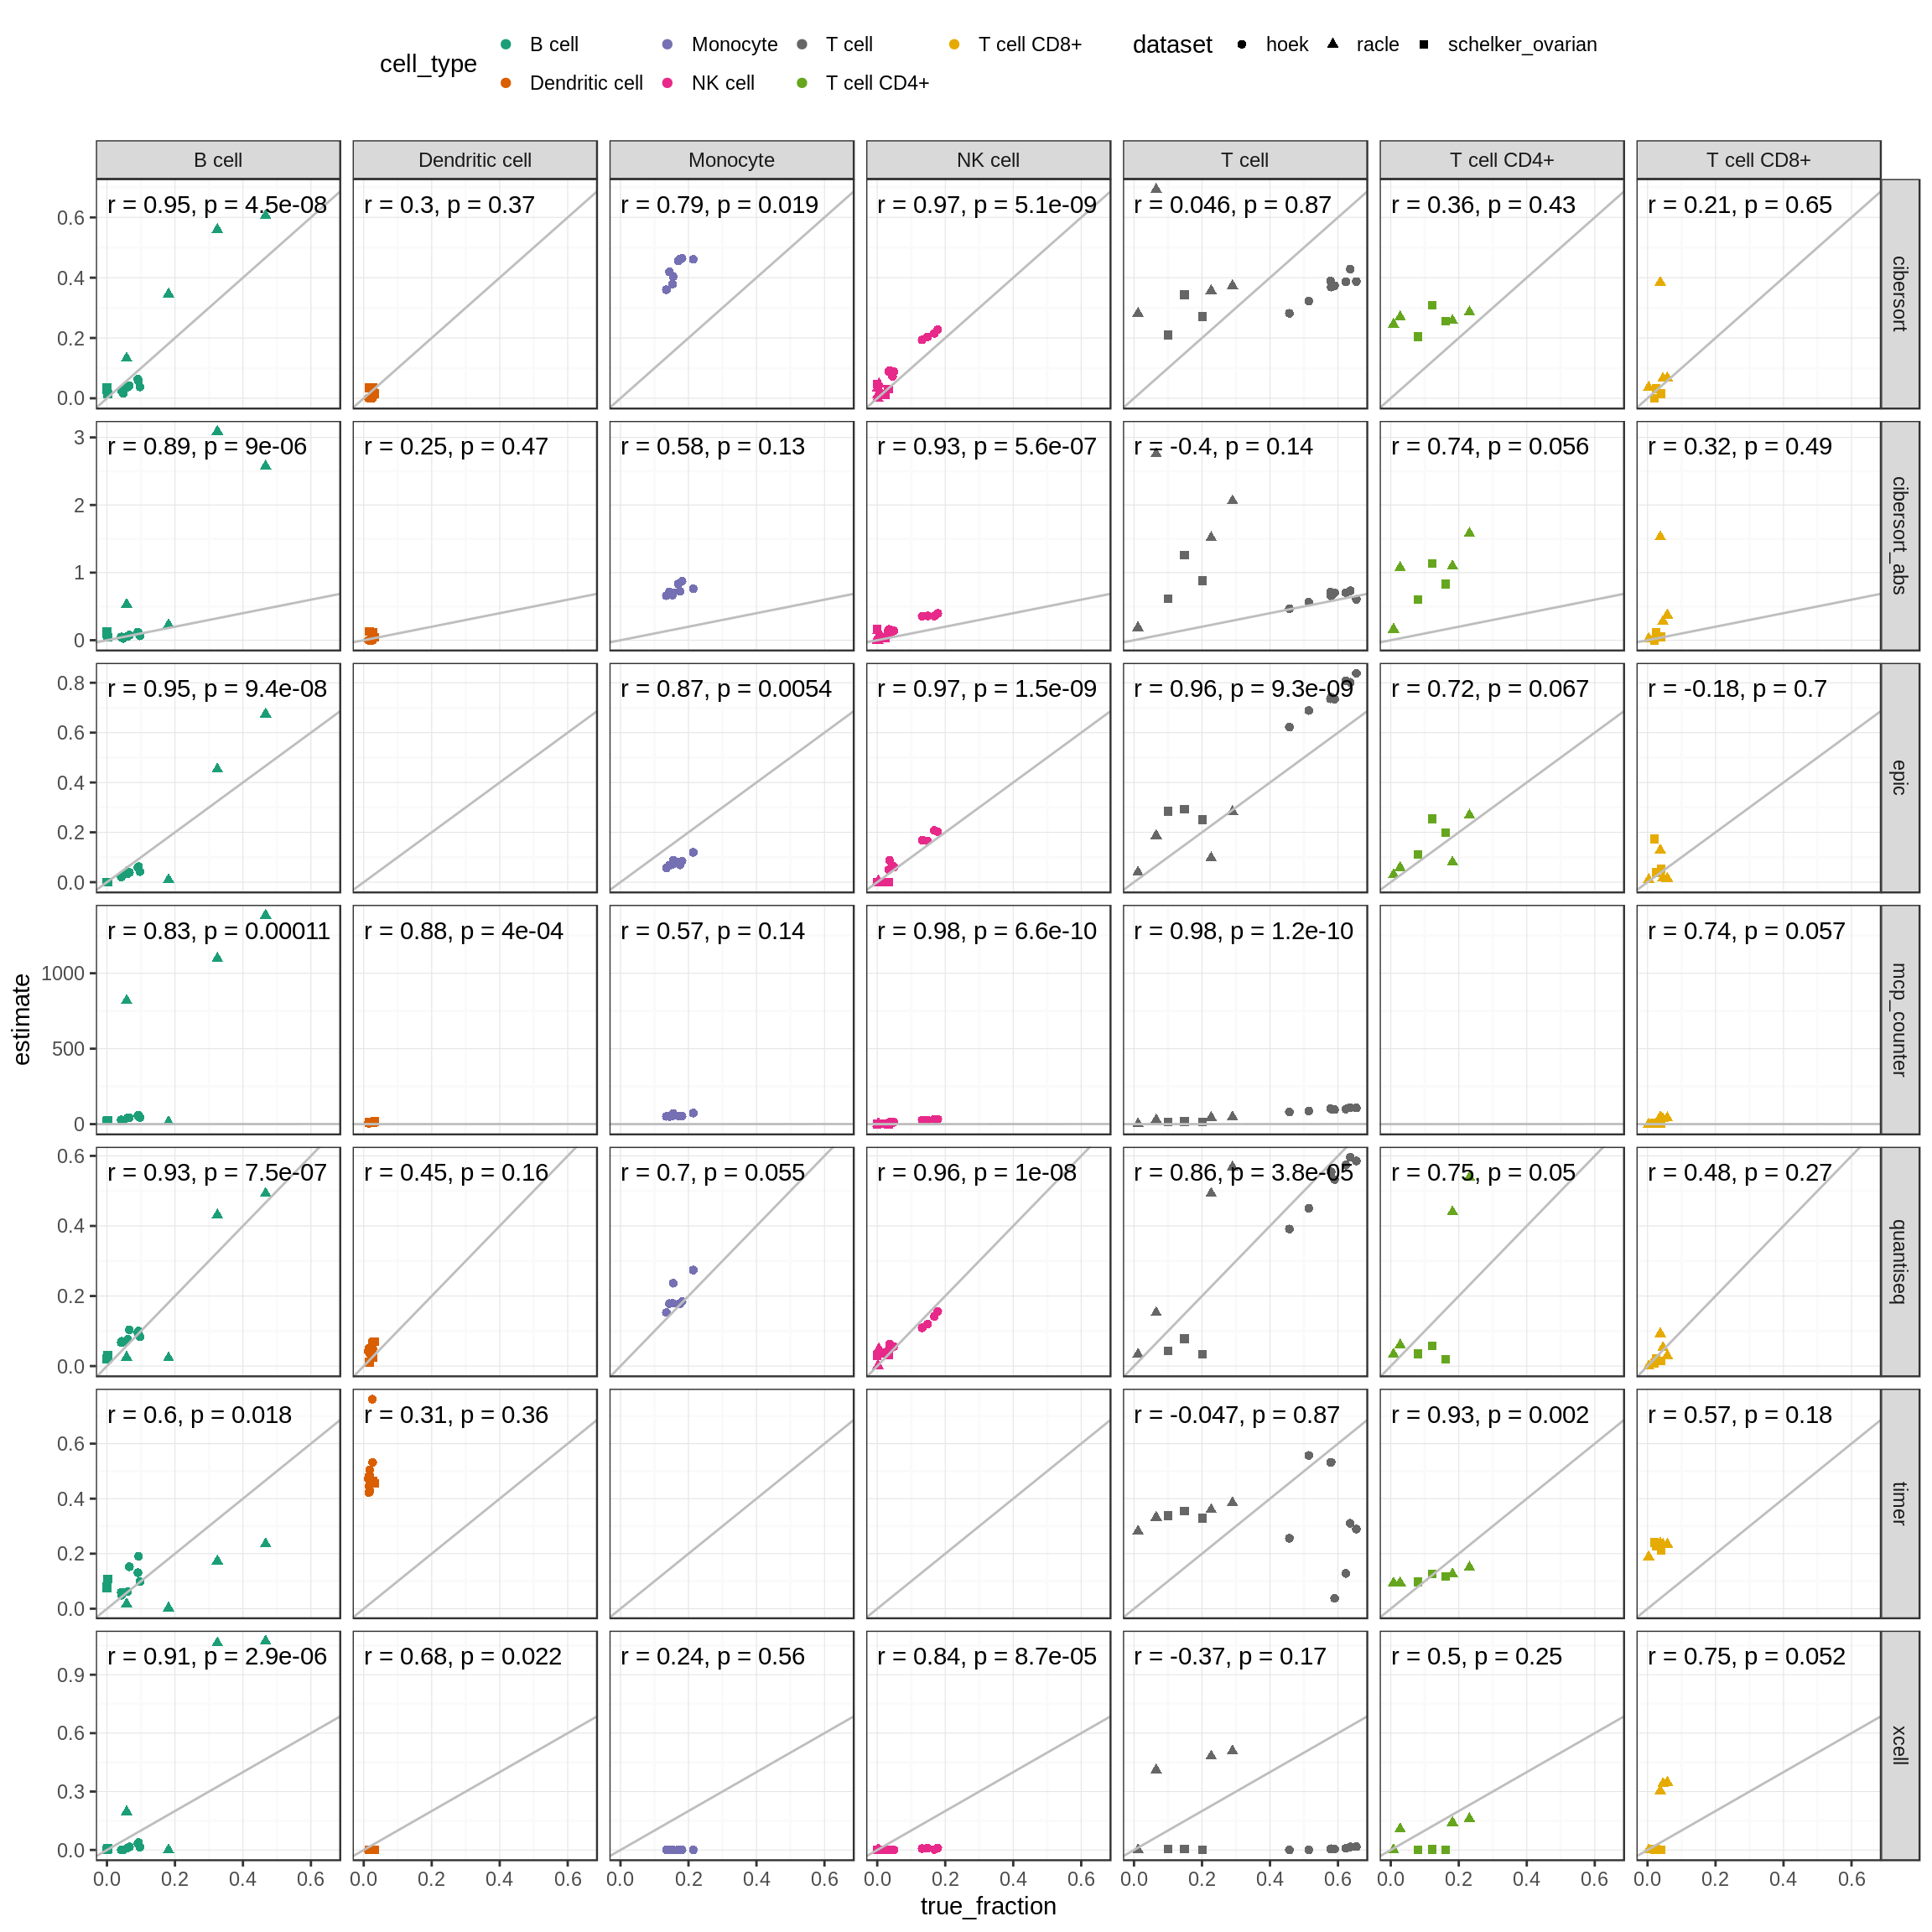
Figure 5.6: Correlations of known vs. predicted fractions for each cell type independenctly. The ‘Tcell’ column corresponds to the amount of profiled total T cells or the sum of CD4+ and CD8+ T cells respectively.
Compute the average over all cell types. We only use cell types with at least 5 samples to obtain reasonable correlation estimates. We also exclude the T-cell supercategory to avoid redundancies.
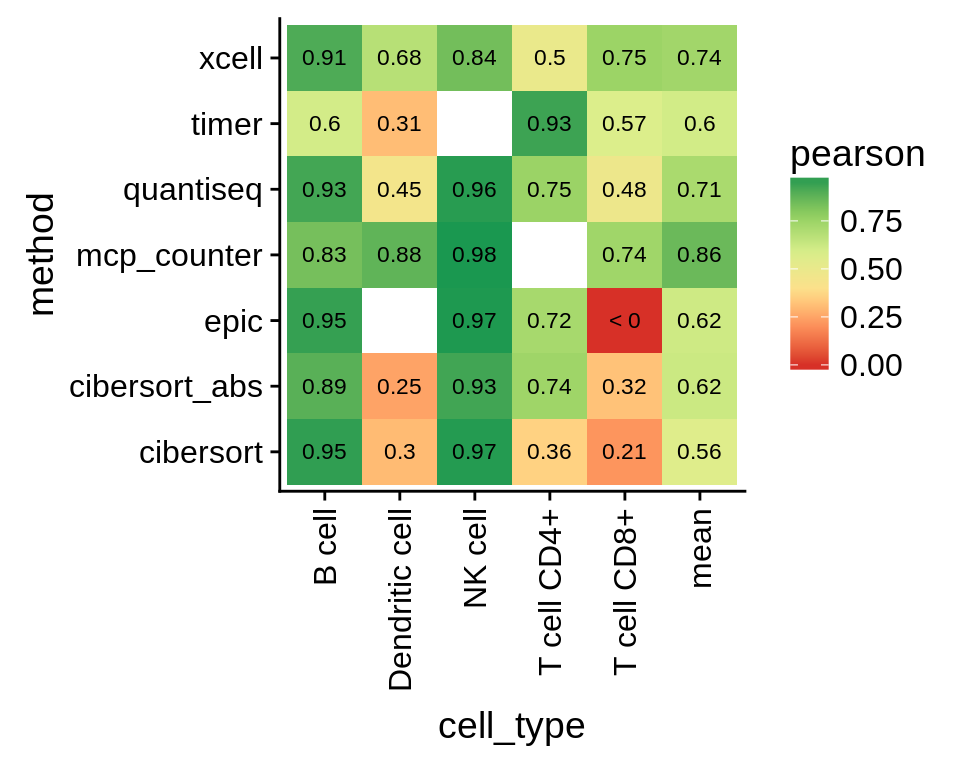
Figure 5.7: Performance on validation datasets by cell type. The last column shows the mean over all cell types.
Note that, although the correlation for CD8+ T cells looks bad, it does not necessarily mean the predictions are bad. There is just little variance between the samples and CD8+ T cell abundance is generally low, which is correlctly predicted by the methods.