3 Validitiy of single cell RNA-seq as reference
Since we rely on simulated bulk RNA-seq samples generated from scRNA-seq data, we first investigate if this approach is valid and will give reasonable estimates of the methods’s performances.
We conduct the following analyses:
- Compare simulated bulk samples with a corresponding genuine bulk sample.
- Check if immune-related genes are subject to a systematic bias.
- Compare the predicted fractions of all methods on bulk vs. simulated samples.
- Compare simulated bulk samples with a reference immune cell sample of the same cell type.
3.1 Compare simululated to genuine bulk samples
provide three samples for which paired single cell and bulk RNA-seq has been performed. We generate simulated bulk RNA-seq samples by taking the average of the single cells and compare the simulated to the genuine samples.
bulk_mean = sapply(colnames(schelker_ovarian$expr_mat), function(donor) {
  ind = pData(single_cell_schelker$eset)$donor == donor
  apply(exprs(single_cell_schelker$eset)[,ind], 1, mean)
})
bulk_mean = apply(bulk_mean, 2, scale_to_million)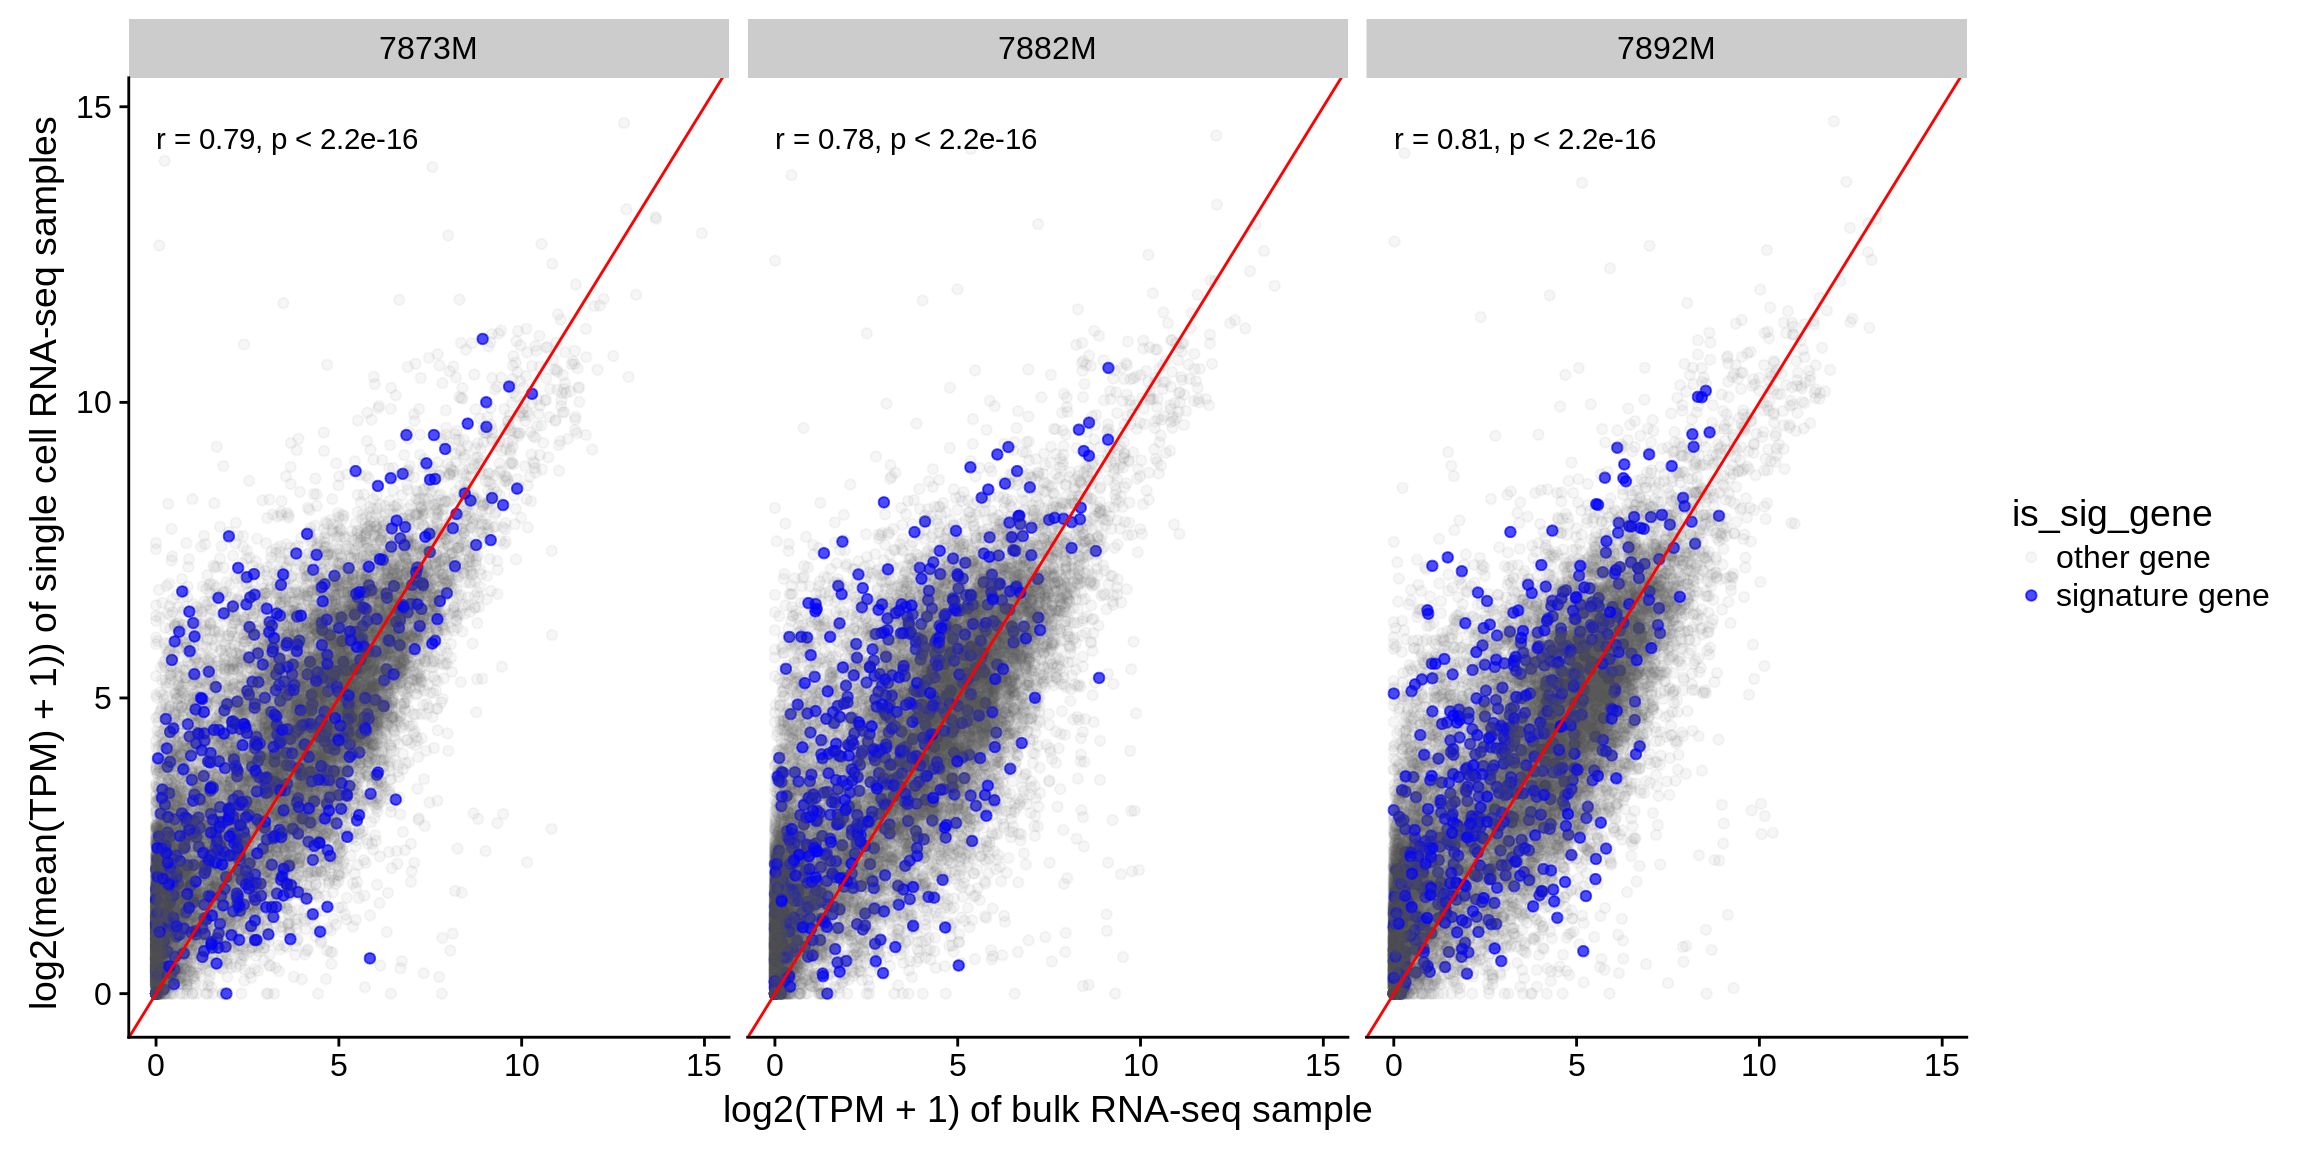
Figure 3.1: Correlation of simulated bulk samples with corresponding genuine bulk RNA-seq samples. Genes used in the signatures of quanTIseq, EPIC, CIBERSORT and MCP-counter are shown in blue.
3.2 Enrichment analysis: Test for systematic Bias
Next, we calculate the sc-bulk log ratio, by \[log(sc+1)/log(bulk+1)\],
We observe that the sc-bulk log ratio showes asymmetry: more genes show increased sc-aggregate expression rather than decreased sc-aggregate expression.
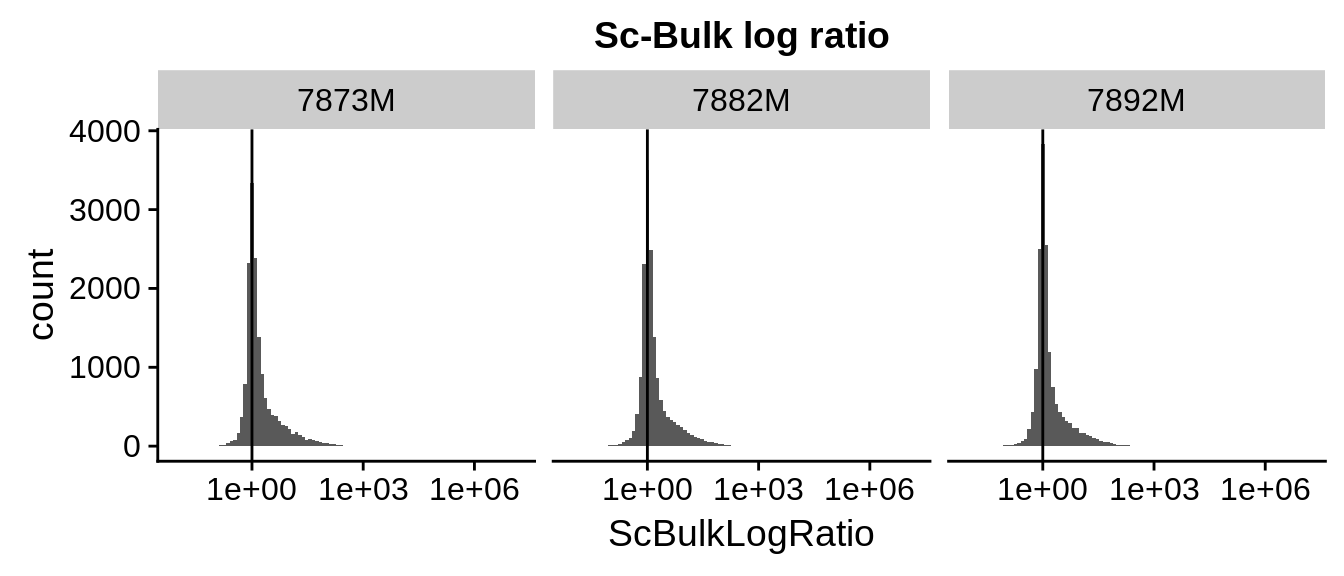
Figure 3.2: log-ratio of single cell agregates to geniune bulk. We observe that the distribution is skewed in direction of the single cells, i.e. more genes have increased gene expression in sc-aggregates rather than decreased.
What are these genes that seem to be higher expressed in single-cell aggregates than bulk? We were wondering if there is a systematic bias towards a certain group of genes that tend to be over/underrepresented in single-cell vs. bulk RNA seq. To this end, we take the geometric mean of the log ratio and run a gene set enrichment test with BioQC, using gene ontology (BP and CC terms) as the knowledgebase.
geomMean <- function(x) 10^(mean(log10(x)))
avgData <- expr_all %>% group_by(gene_symbol) %>% summarise(MeanBulk=geomMean(bulk),
                                                            MeanSc=geomMean(single_cell_aggregate),
                                                            MeanScBulkLogRatio=geomMean(ScBulkLogRatio))
## translate gene symbol into EntrezIds
gsIDs <- AnnotationDbi::select(org.Hs.eg.db, avgData$gene_symbol, c("ENTREZID"), "SYMBOL")
annoAvgData <- avgData %>% inner_join(gsIDs, by=c("gene_symbol"="SYMBOL")) %>%
  rename(GeneID=ENTREZID) %>%
  filter(!is.na(GeneID)) %>% dplyr::rename(GeneSymbol = gene_symbol) %>%
  dplyr::select(GeneID, GeneSymbol, MeanBulk, MeanSc, MeanScBulkLogRatio)
## build up a list of GO gene-sets
go <- AnnotationDbi::select(org.Hs.eg.db, annoAvgData$GeneID, c("GO"), "ENTREZID") %>%
  filter(ONTOLOGY %in% c("BP","CC"),
         EVIDENCE %in% c("EXP", "IDA", "IPI", "IMP", "IGI", "IEP"))
goList <- with(go, split(ENTREZID, GO))
goMatchList <- sapply(goList, function(x) match(x, annoAvgData$GeneID))
goMatchListLen <- sapply(goMatchList, length)
goBioQClist <- goMatchList[goMatchListLen>=5 & goMatchListLen<=1000]
## Run two-sided Wilcoxon-Mann-Whitney test using sc-bulk log ratios
goBioQCp <- wmwTest(annoAvgData$MeanScBulkLogRatio, goBioQClist,
                      valType="p.two.sided")
goBioQCq <- wmwTest(annoAvgData$MeanScBulkLogRatio, goBioQClist,
                      valType="Q")
goBioQClistAnno <- AnnotationDbi::select(GO.db, names(goBioQClist), c("ONTOLOGY", "TERM"), "GOID")
goBioQCres <- cbind(goBioQClistAnno,
                    GeneCount=sapply(goBioQClist, length),
                    BioQC.twosided.pvalue=goBioQCp,
                    BioQC.Qvalue=goBioQCq,
                    FDR=p.adjust(goBioQCp, "BH"),
                    Bonferroni=p.adjust(goBioQCp, "bonferroni"))
#TODO table width and round pvalues
Below we display the terms that, under moderate stringency of filtering (Benjamini-Hochberg FDR<0.01), shows significant enrichment in either direction.
Interstingly, there are many terms that are highly significantly over- or underrepresented in simulated versus genuine bulk RNA-seq samples. We currently have no explanation for that.
3.2.1 Immune-relevant genes are consistent between sc and bulk data.
We notice that among these significantly enriched gene-sets above, no gene-sets are directly involved in immune response, cytokine/interleukin/chemokine response.
Alternatively, we show these immune-relevant gene-sets and their results by an incomprehensive keyword search, to further demonstrating that they do not show strong difference between sc-aggregated and bulk data.
isImmune <- with(goBioQCres,
                 grepl("immune\\b", TERM, ignore.case=TRUE) |
                                   grepl("inflammation\\b", TERM, ignore.case=TRUE) |
                                  grepl("cytokine\\b", TERM, ignore.case=TRUE) |
                                     grepl("chemokine\\b", TERM, ignore.case=TRUE) |
                                    grepl("interleukin\\b", TERM, ignore.case=TRUE) |
                                    grepl("antigen\\b", TERM, ignore.case=TRUE) |
                                    grepl("macrophage\\b", TERM, ignore.case=TRUE) |
                                    grepl("dendritic cell\\b", TERM, ignore.case=TRUE))
immuneRes <- goBioQCres %>% filter(isImmune) %>% arrange(FDR)

immuneRes %>% write_tsv("../results/tables/go_enrichment_immune_bulk_single_cell.tsv")

immuneRes %>% arrange(FDR) %>% DT::datatable(options = list(scrollX="500px")) %>% DT::formatSignif(columns=c("BioQC.twosided.pvalue", "BioQC.Qvalue", "FDR", "Bonferroni"))
All in all the bulk expression data and aggregated single-cell data are concordant, using a very rough method (non-parameterized gene-set enrichment test with BioQC), we observe that some classes of genes, such as protein ubiquitination/deubiquitination, spindle organization, and plama membrane genes, show tendency to be over- od under-represented in single-cell aggregates than bulk data. The reason of this observation is not clear.
However, we note that, by a limited keyword-search, we found that there is no significant enrichment of gene-ontology terms invovled in immune response that are significantly different between scRNA and bulk data. This further underlines the legitimity of using this particular pair of aggregated single-cell data and paired bulk sequencing data to benchmark different methods.
3.3 Compare predicted fractions
Most importantly, we ask how consistent the methods’ predictions are on simulated vs. genuine bulk RNA-seq samples. We run all methods on both datasets and compare the results.
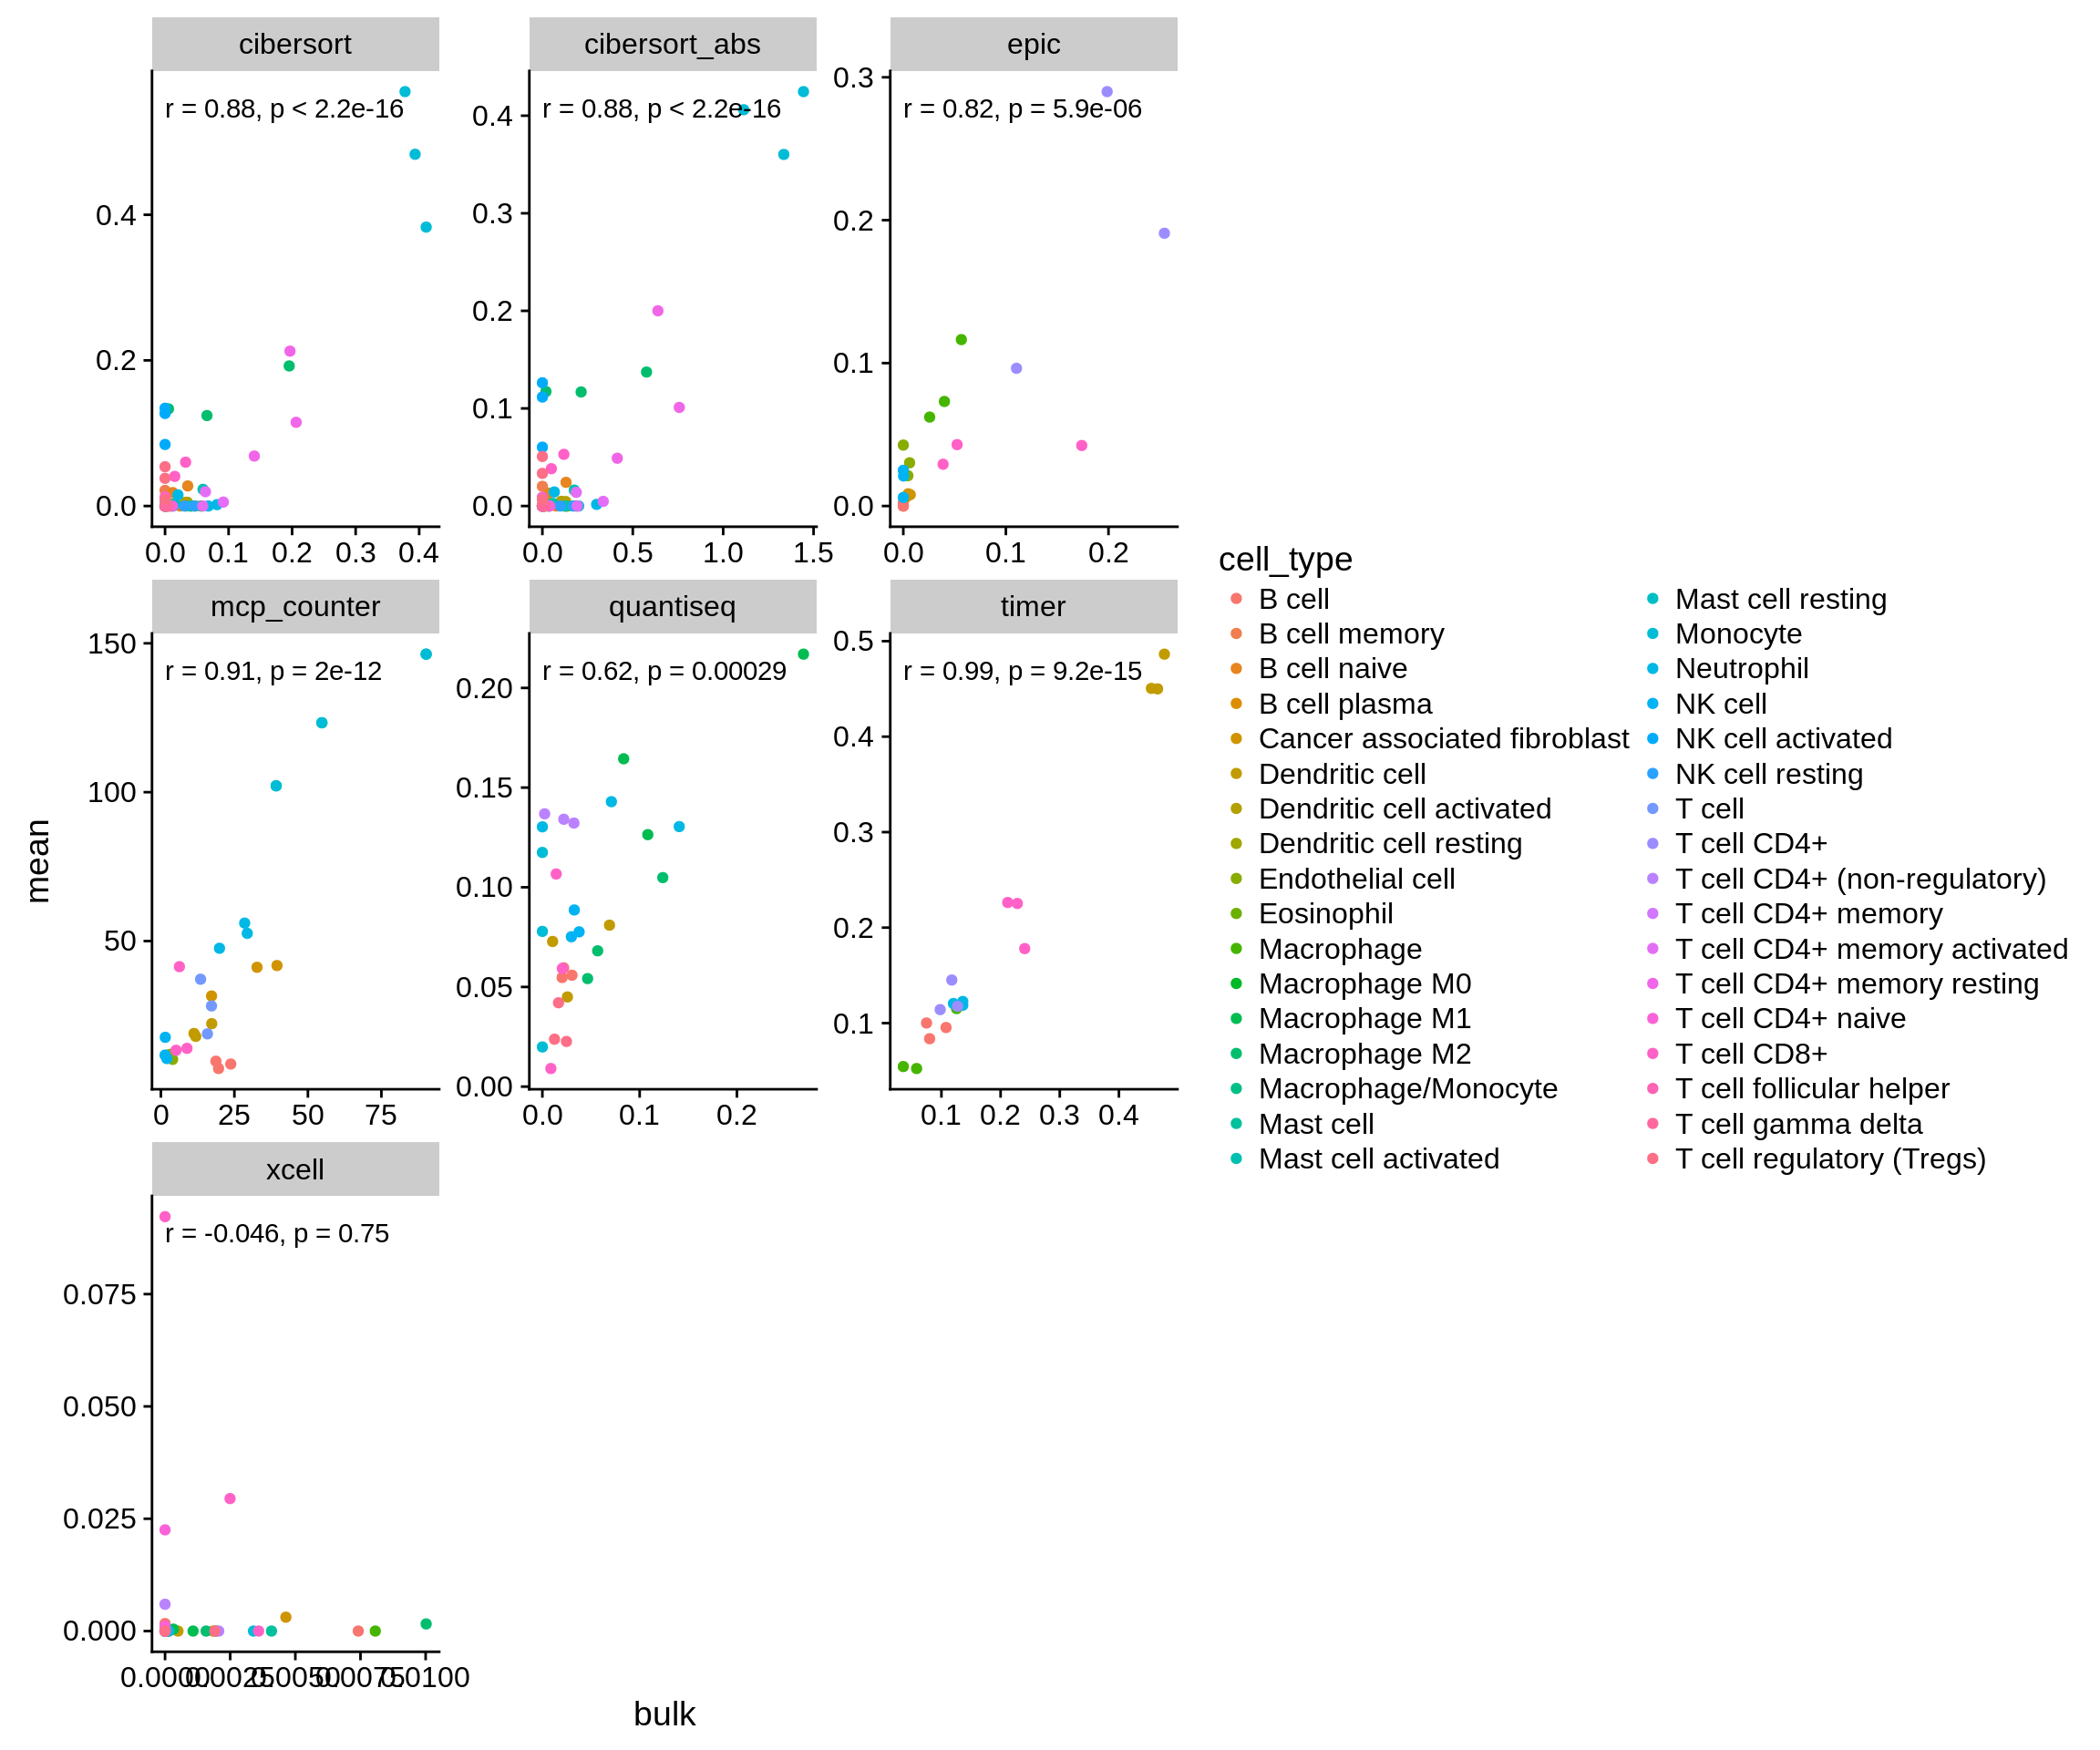
Figure 3.3: Correlation of the methods’ predictions on both simulated and genuine bulk RNA-seq samples
The same, but only with the cell types we look at:
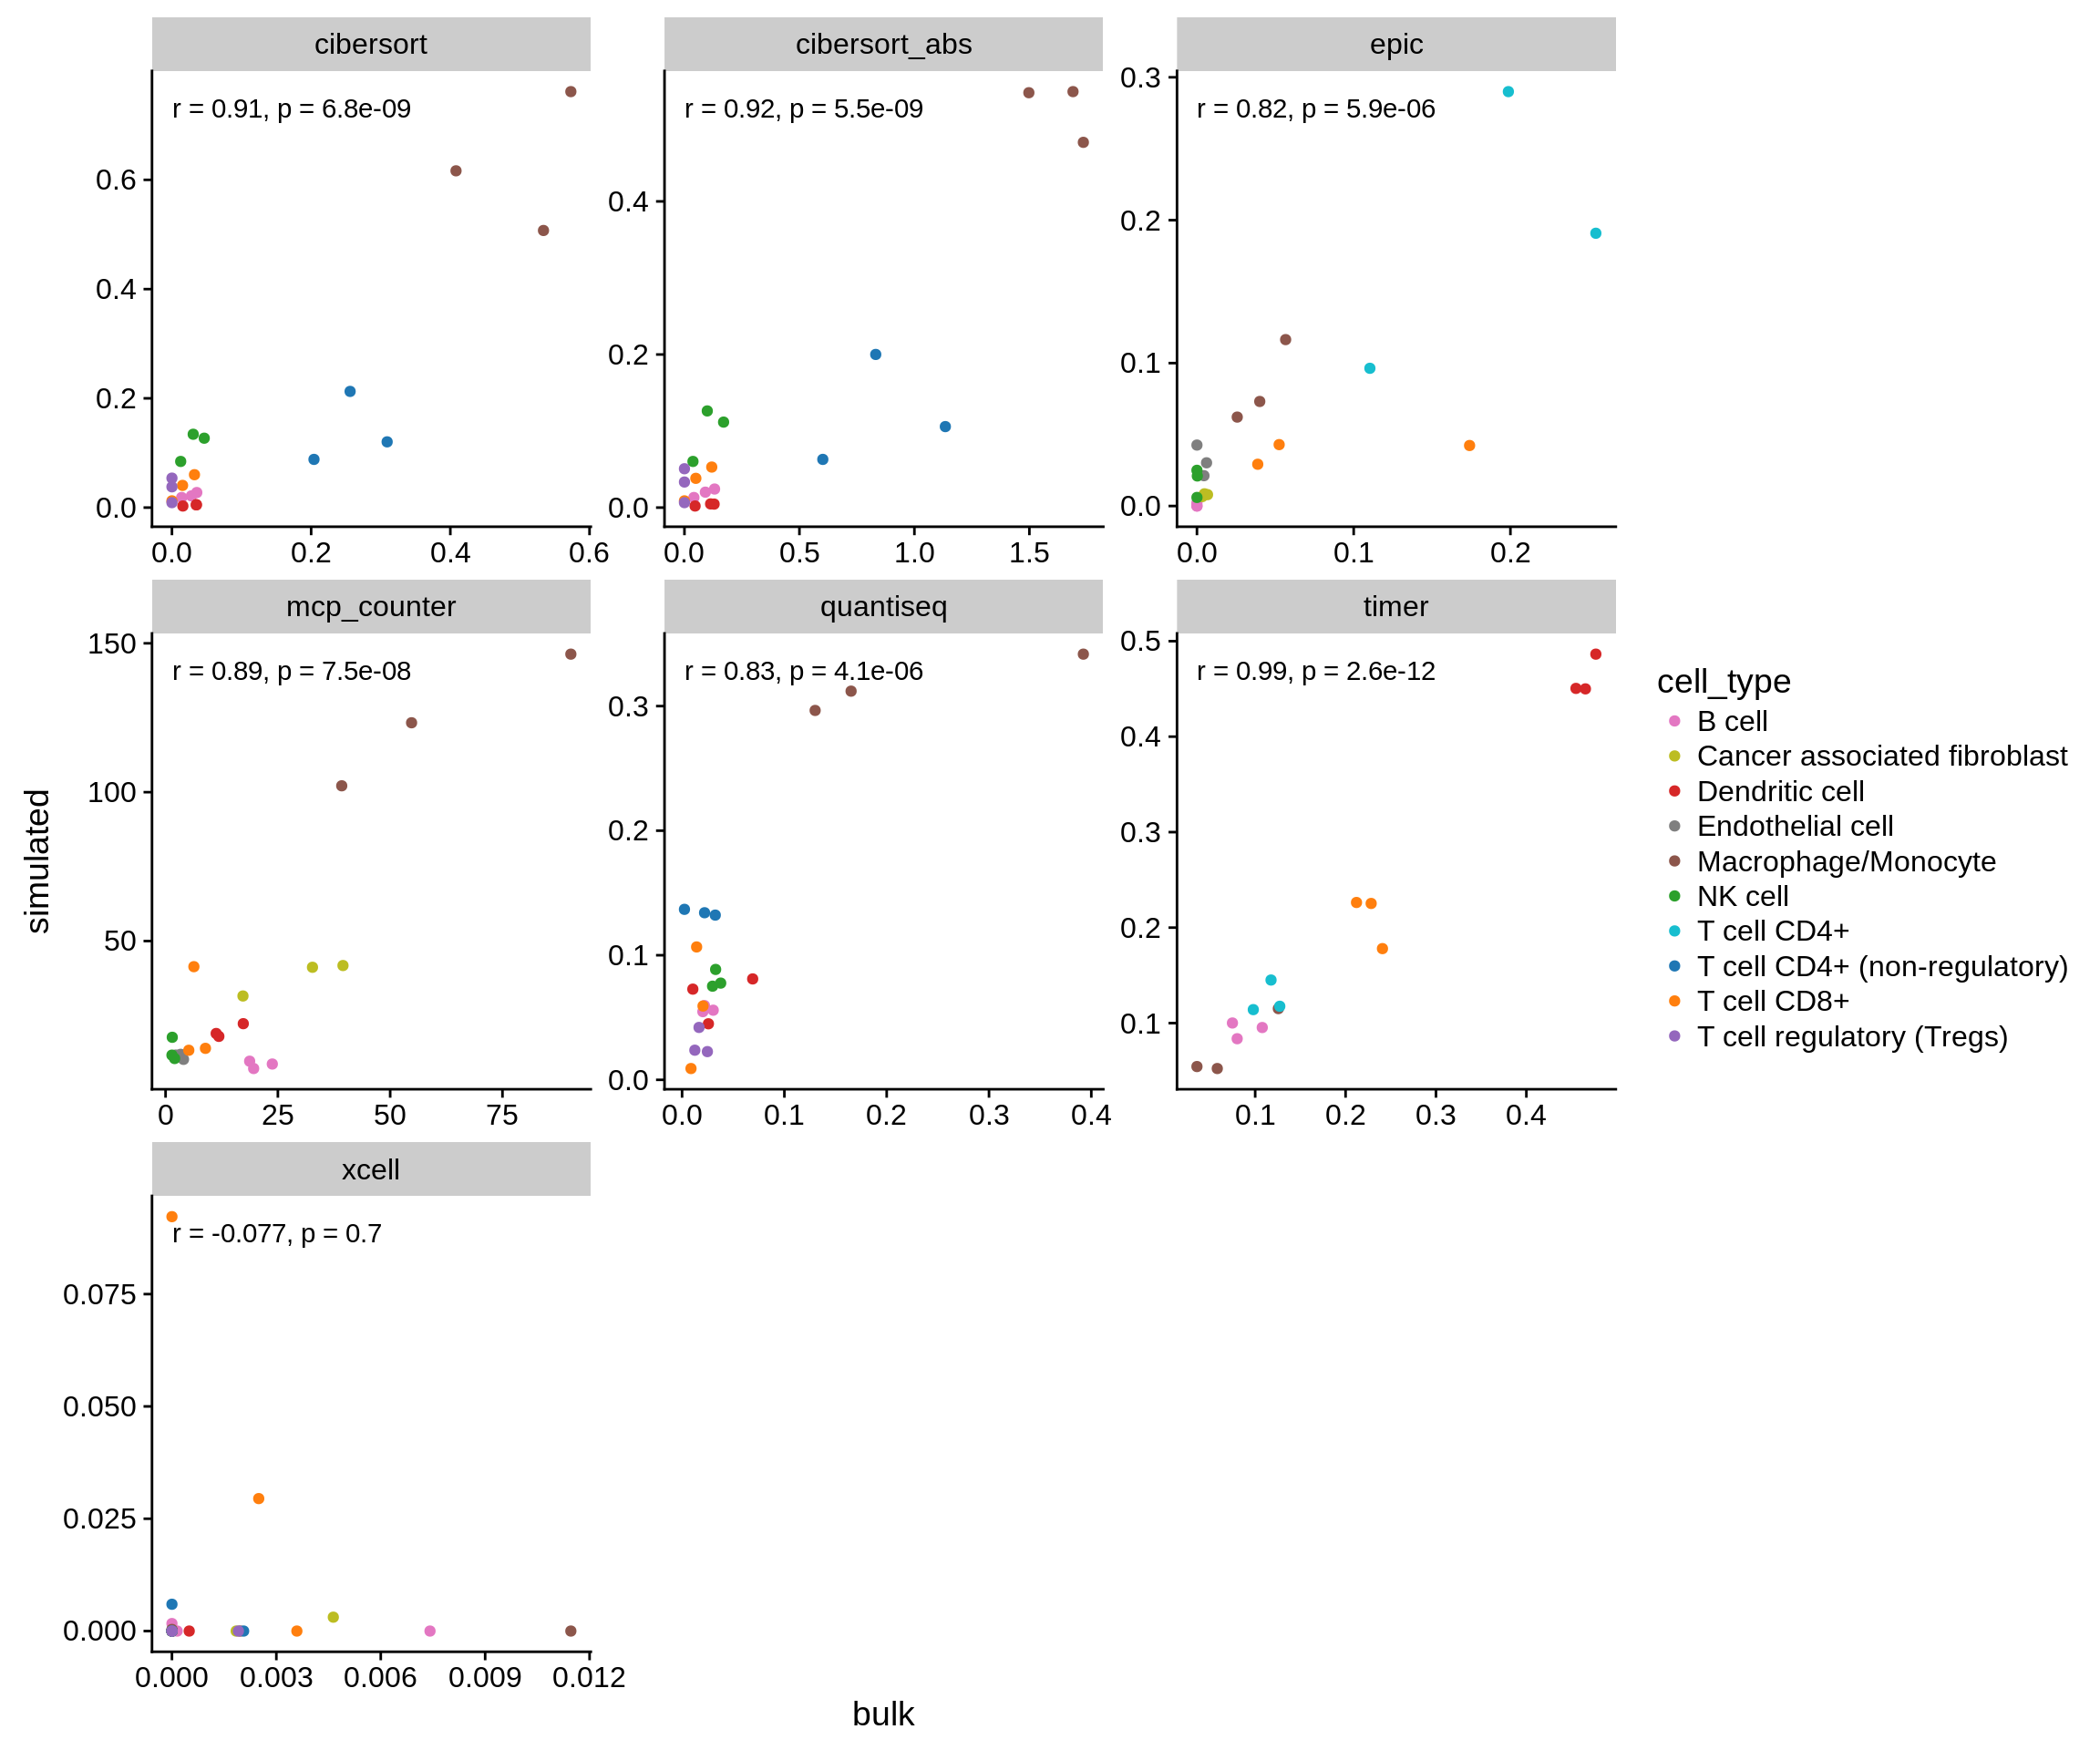
Figure 3.4: Correlation of the methods’ predictions on both simulated and genuine bulk RNA-seq samples on the cell types used in the benchmark only.
The results show a strong correlation between both datasets and suggest that the approach is valid in general. The poor overlap of xCell is proabably due to the fact that there is little variance between the samples which xCell requires to compute a meaningful score (see their README on GitHub).
To demonstrate that this is the case, we run xCell on the same sample, but this time include 50 immune cell reference samples in the run. By adding additional samples, we add additional variance which enables xCell to compute a meaningful score.
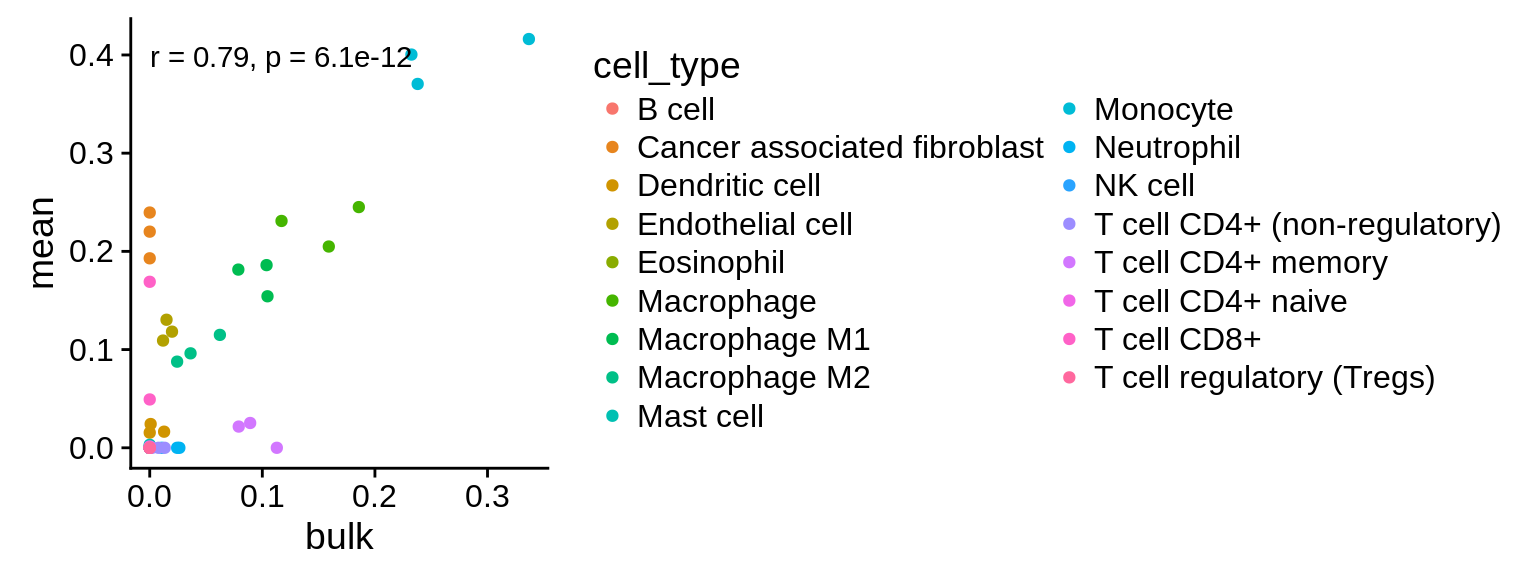
Figure 3.5: Correlation of xCell’s prediction on both simulated and genuine bulk RNA-seq samples, including additional samples to increase the variance.
3.4 Correlation with immune reference samples.
Finally, to demonstrate that the simulated bulk samples are also biologically meaningflu, we generate simulated bulk samples of different immune cell types and correlate them with reference profiles of pure immune cells.
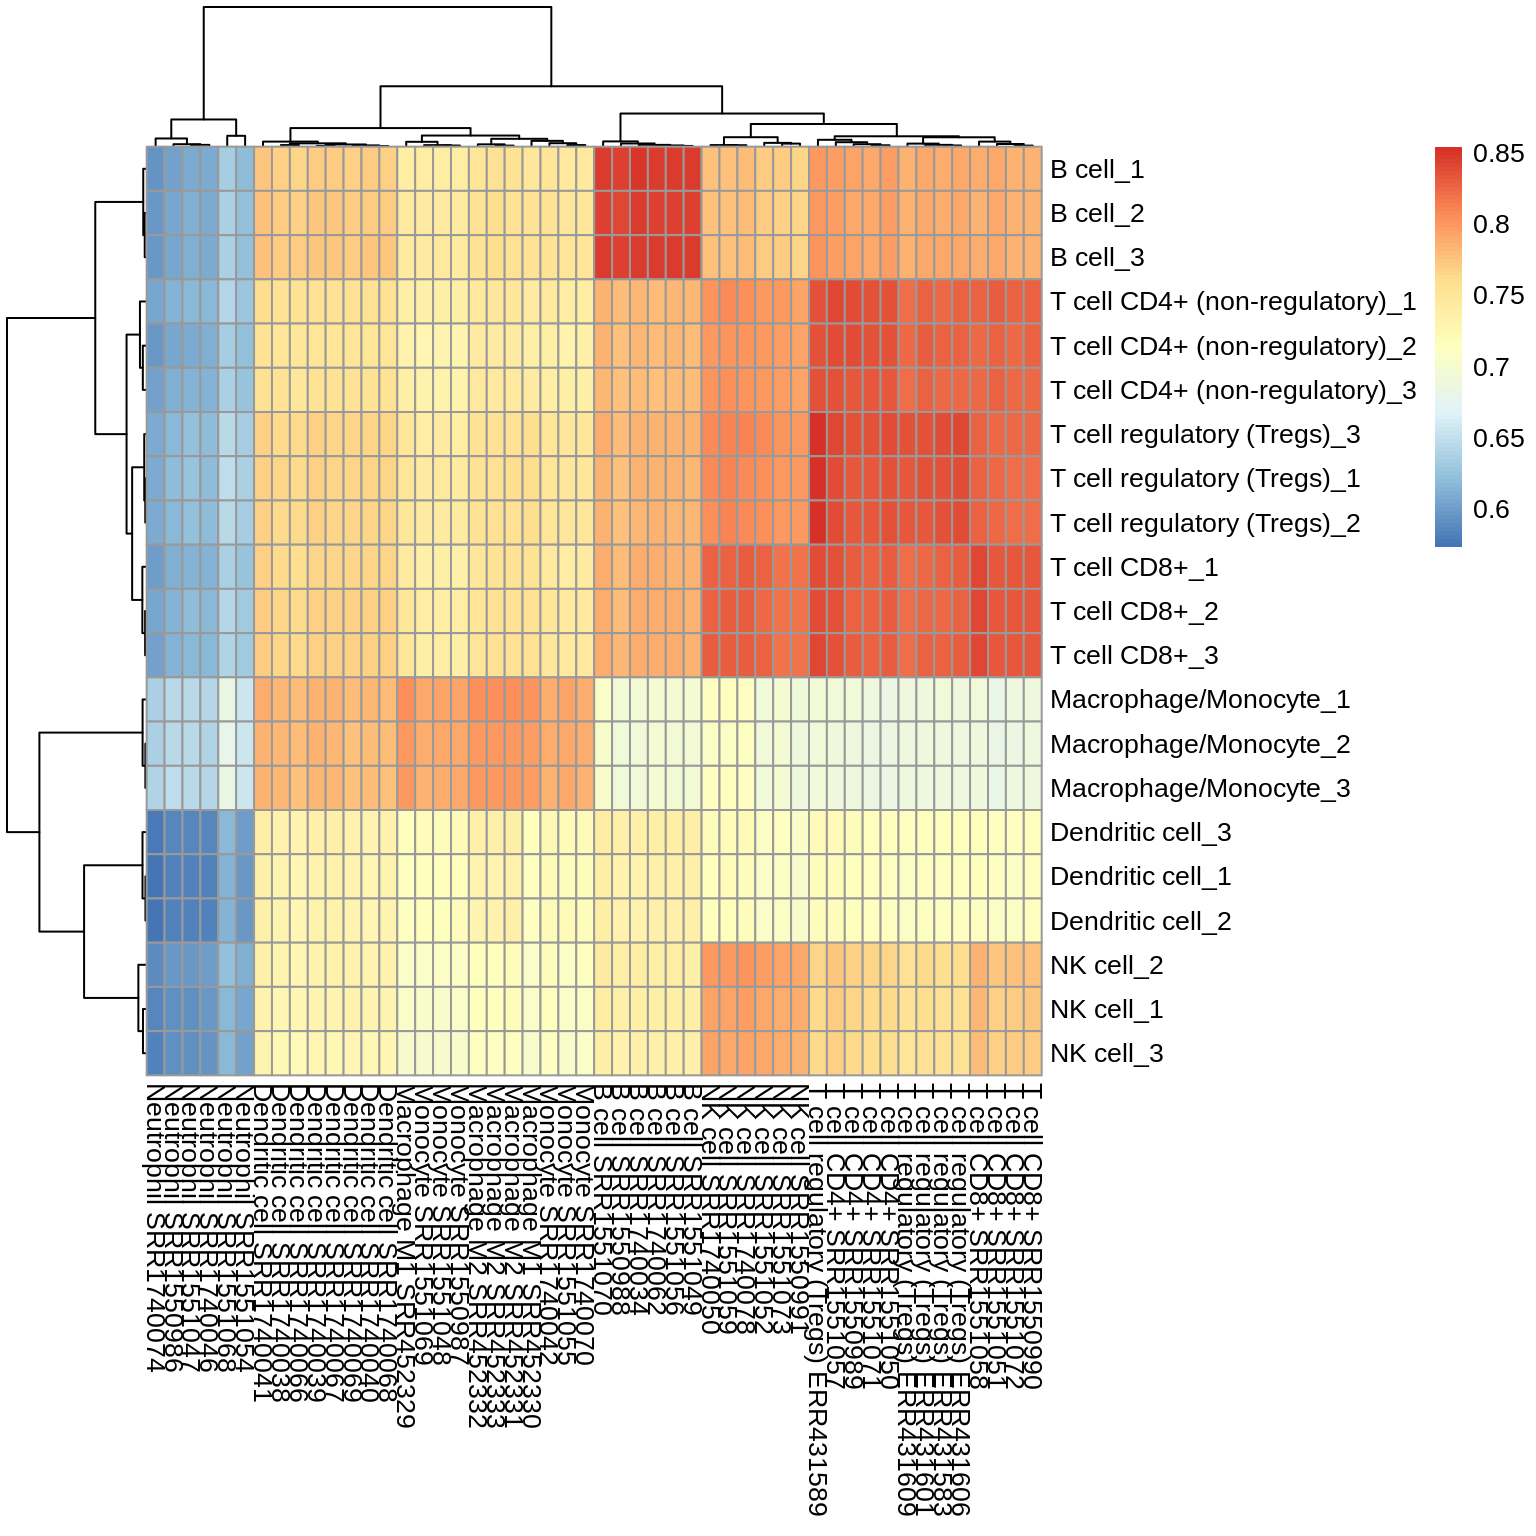
Figure 3.6: Correlation of simulated bulk samples of a certain immune cell type (y-axis) with immune cell reference samples (x-axis)
In general, the highest correlation is observed between the expression of the sorted cells and the simulated bulk sample. However, the simulated Dendritic cells do not correlate well with any of the reference profiles.