4 Simulation benchmark
In this chapter, we will use single cell data from Schelker et al. (2017) to create simulated bulk RNAseq samples of which we know the true cell proportions (=artificial gold standard). Using these data, we can assess the performance of immune deconvolution tools.
4.1 Average fraction of tumour cells
To obtain representatitive simulated samples, we are interested in the average fraction of tumour cells vs immune cells in a mixture.
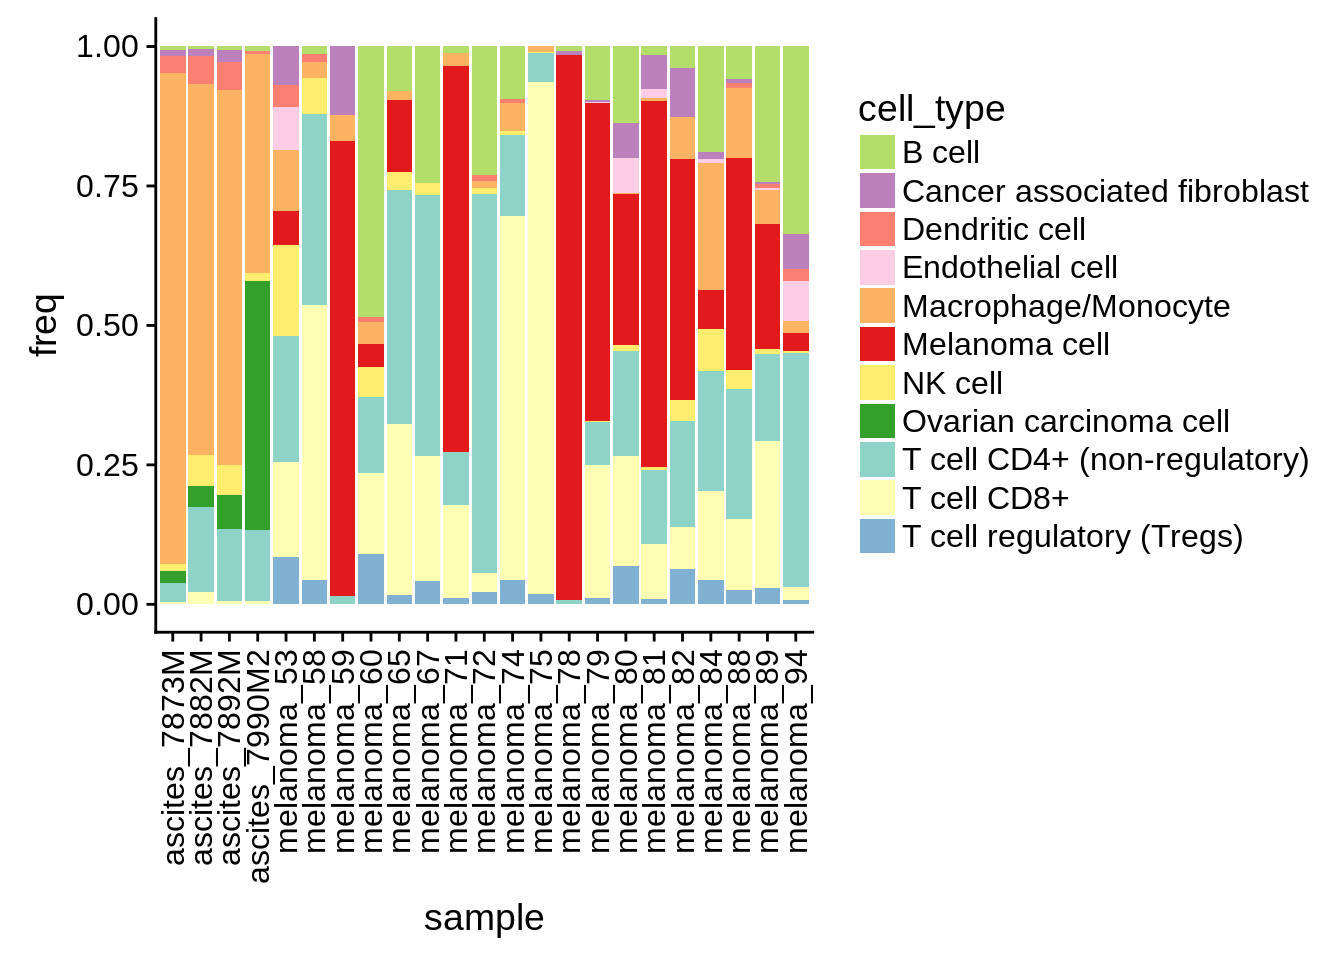
Figure 4.1: proportion of cell types by tumor sample
The empirical distribution of the cancer fraction is \(\sim\mathcal{N}(0.33, 0.3)\).
4.2 Create simulated bulk tissues
The fractions of a sample are randomly assigned in the following procedure:
- Draw a random tumour cell content from the distribution fitted above
- The first half of the samples will use melanoma cells, the second half ovarian cancer cells.
- Assign the remaining fraction (=not cancer cells) randomly to the remaining cell types (B cell, T cell CD8+, Melanoma cell, T cell CD4+ (non-regulatory), Macrophage/Monocyte, T cell regulatory (Tregs), Cancer associated fibroblast, Dendritic cell, Endothelial cell, NK cell, PBMC, Ovarian carcinoma cell)
Here, we generate a simulated bulk RNA-seq ExpressionSet:
4.3 Run the deconvolution
We run the methods with tumor = TRUE and scale_mrna = FALSE where applicable, as
the mRNA scaling is inappropriate for already normalized single cells. In any case,
the mRNA scaling factors have no influence on the correlations between estimated and
known fractions.
timer_indications = ifelse(is_melanoma, "SKCM", "OV")
all_results = foreach(method=config$deconvolution_methods,
                      .final = function(x) {setNames(x, config$deconvolution_methods)}) %dopar% {
  deconvolute(bulk_eset, method, column="gene_symbol", indications = timer_indications, scale_mrna = FALSE, tumor = TRUE)
}
4.4 Results
We perform an evaluation for the following cell types. Note that some cell types are redundant (T cell CD4+ is a super-category of Tregs and non-regulatory CD4+ T cells). As some methods provide deconvolution only at the CD4+ level, we compare both categories:
show_cell_types = c("B cell", "Dendritic cell", "Macrophage/Monocyte",
                    "NK cell", "T cell CD4+", "T cell CD4+ (non-regulatory)",
                    "T cell regulatory (Tregs)", "T cell CD8+",
                    "Cancer associated fibroblast", "Endothelial cell")
The following methods do not have signatures to quantify “Macrophages/Monocytes”. EPIC and TIMER only provide a Macrophage signature, while MCP-counter only provides a signature “Monocytic lineage”, which also includes myeloid dendritic cells. Unfortunately, our single cell dataset does not distinguish between Macrophages and Monocytes. As we are only comparing correlations here, the subsitute signatures should still yield appropriate results, yet, we label the results accordingly
Here, we map the results back to the “gold standard”. We aggregate the results of the different methods into a single table and clean it up for further processing.
results_with_gold_standard = inner_join(all_results_tidy, gold_standard,
                                        by=c("sample", "cell_type"))
res_mixing_study$all_results = results_with_gold_standard
4.4.1 Correlation plots
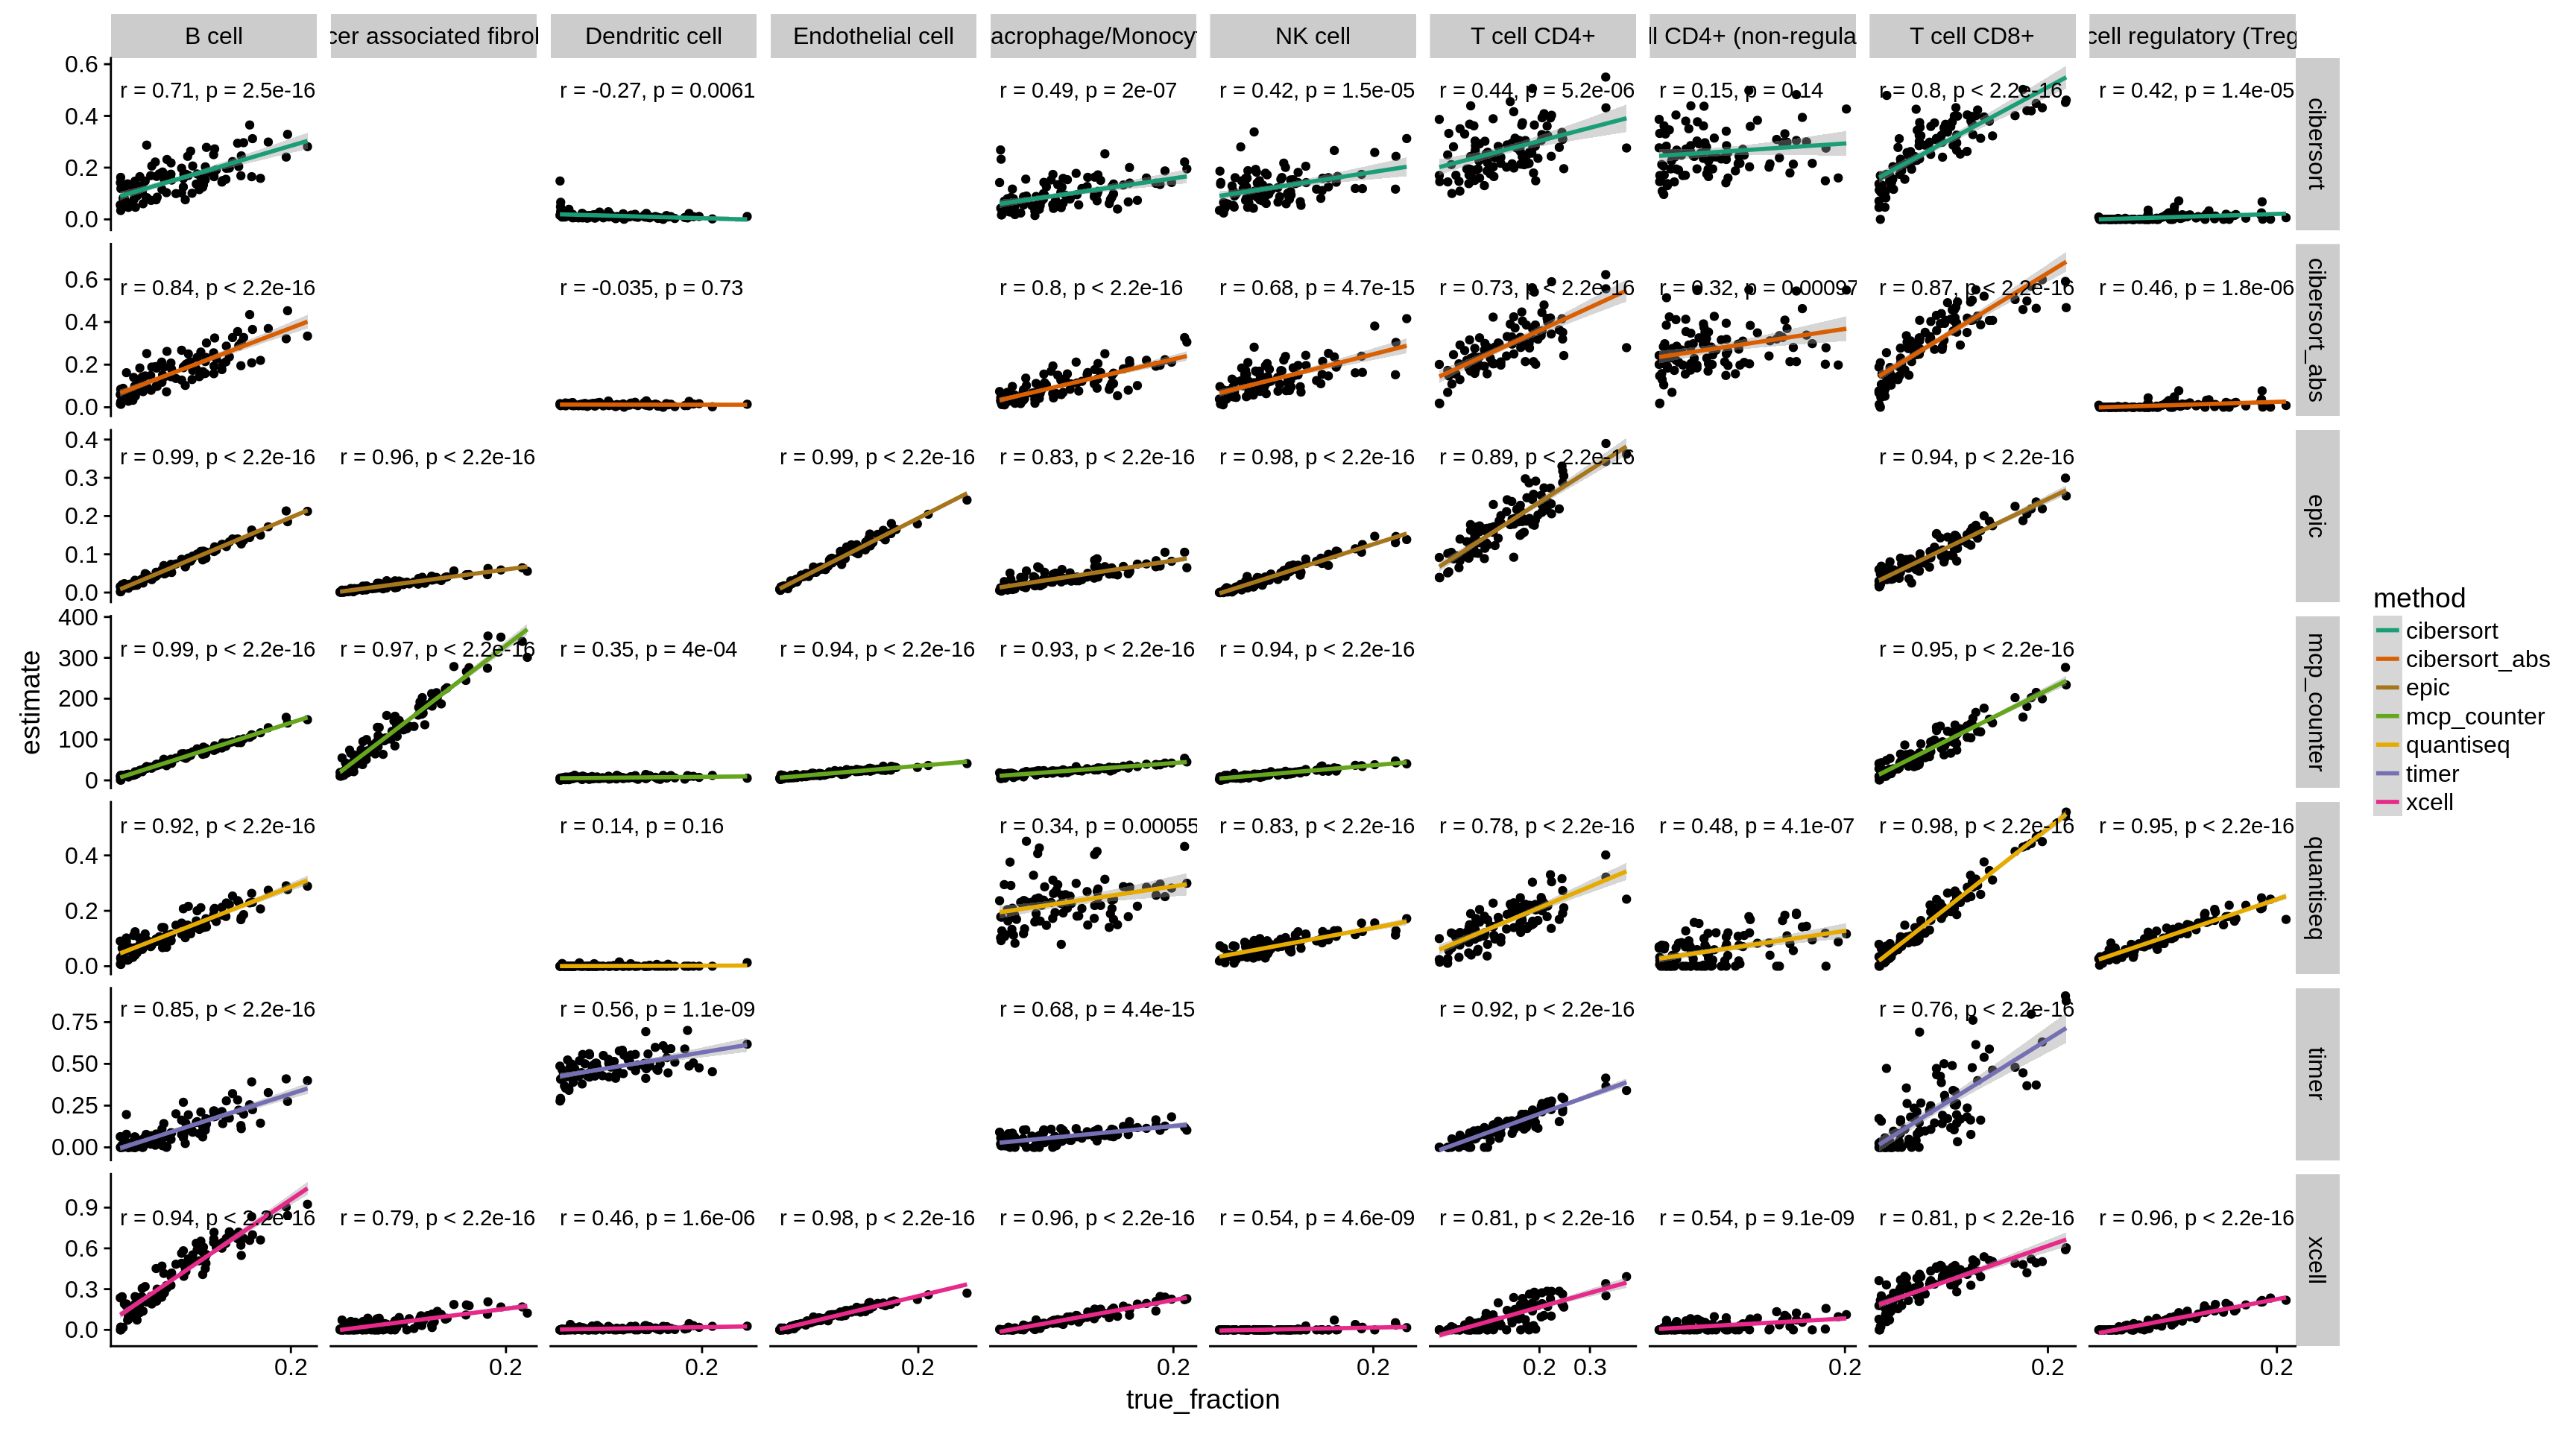
Figure 4.2: The figure shows the correlation of predicted vs. known fractions on 100 simulated bulk RNA seq samples.
4.4.2 Calculate correlations for each method and cell type
correlations_tab = correlations %>% select(cell_type, method, pearson) %>%
  spread(cell_type, pearson)

write_tsv(correlations_tab, "../results/tables/mixing_study_correlations.tsv", na="")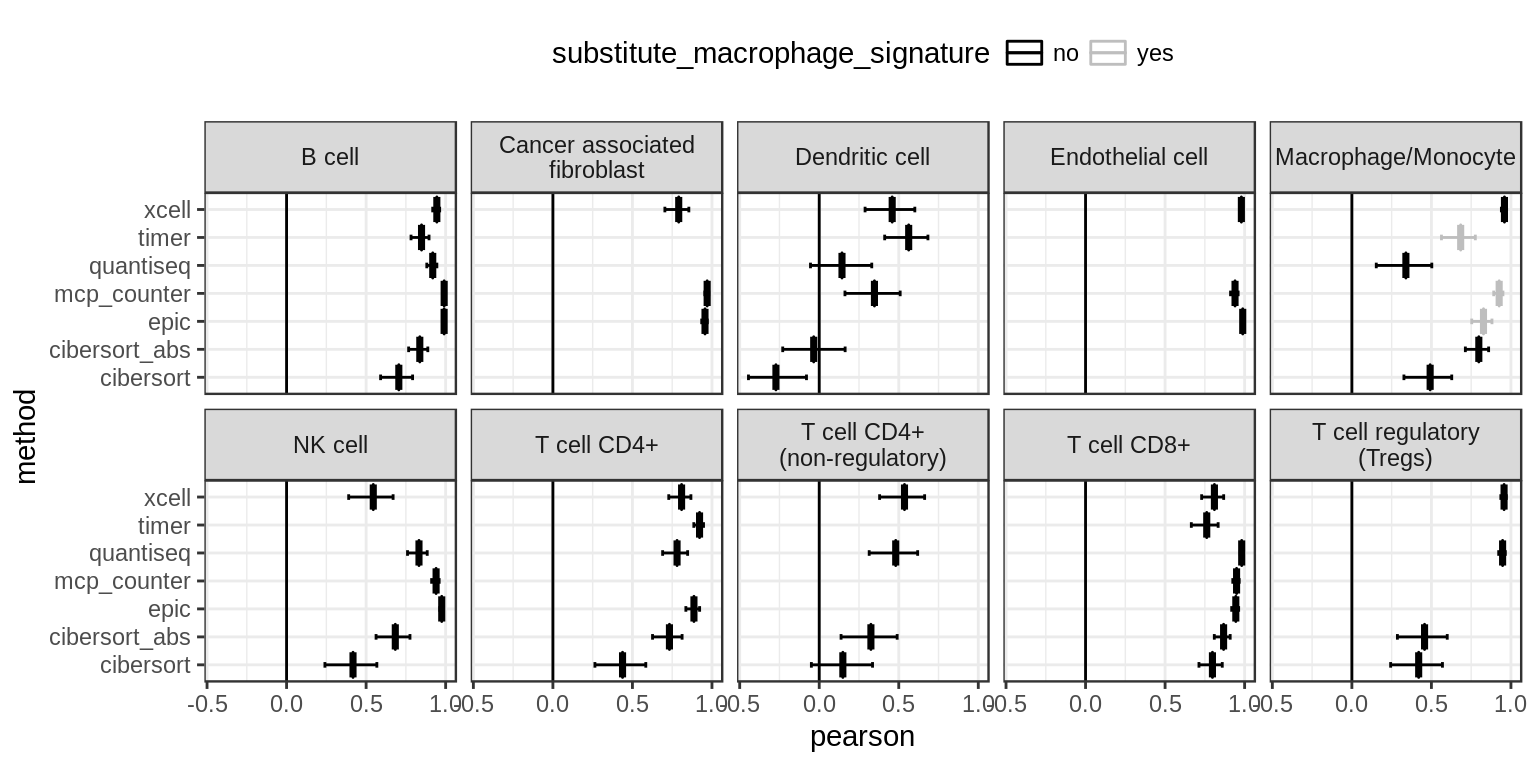
Figure 4.3: Correlations of predicted vs. known fractions on 100 simulated bulk RNA-seq samples, organized by cell type.
4.4.3 Absolute deviation
treat with caution!
Next, we were interested in the absolute deviation of the values for methods that compute absolute scores. We assess the absolute deviation using two measures:
- by fitting a linear model to the values and denoting the slope. If the absolute quantification was perfect, the slope would equal 1. Values < 1 indicate an underprediction and values > 1 an overprediction of the respective cell type.
- by calculating the root mean square error (RMSE)
Note that only EPIC and quanTIseq provide scores that can be interpreted as a cell fraction. xCell and CIBERSORT abs. scale the output score to be ‘absolute’:
xCell does an attempt to make the scores resemble percentages, but it is a hard problem, and is very platform and experiment specific. (xCell on github
Absolute mode scales relative cellular fractions into a score of arbitrary units that reflects the absolute proportion of each cell type in a mixture. Although not currently expressed as a fraction, the absolute score can be directly compared across cell types (i.e., relative differences between cell types are maintained) (cibersort FAQ)
Also note that these values are not necessarily accurate for quanTIseq and EPIC, which account for the different mRNA contents of different cell types. As single cell data is already normalized on a per-cell level, the scaling factors are most likely not appropriate with the simulated data. We generated the same plots on the validation data sets (geniune bulk RNA-seq + FACS), which we expect to be more representative!
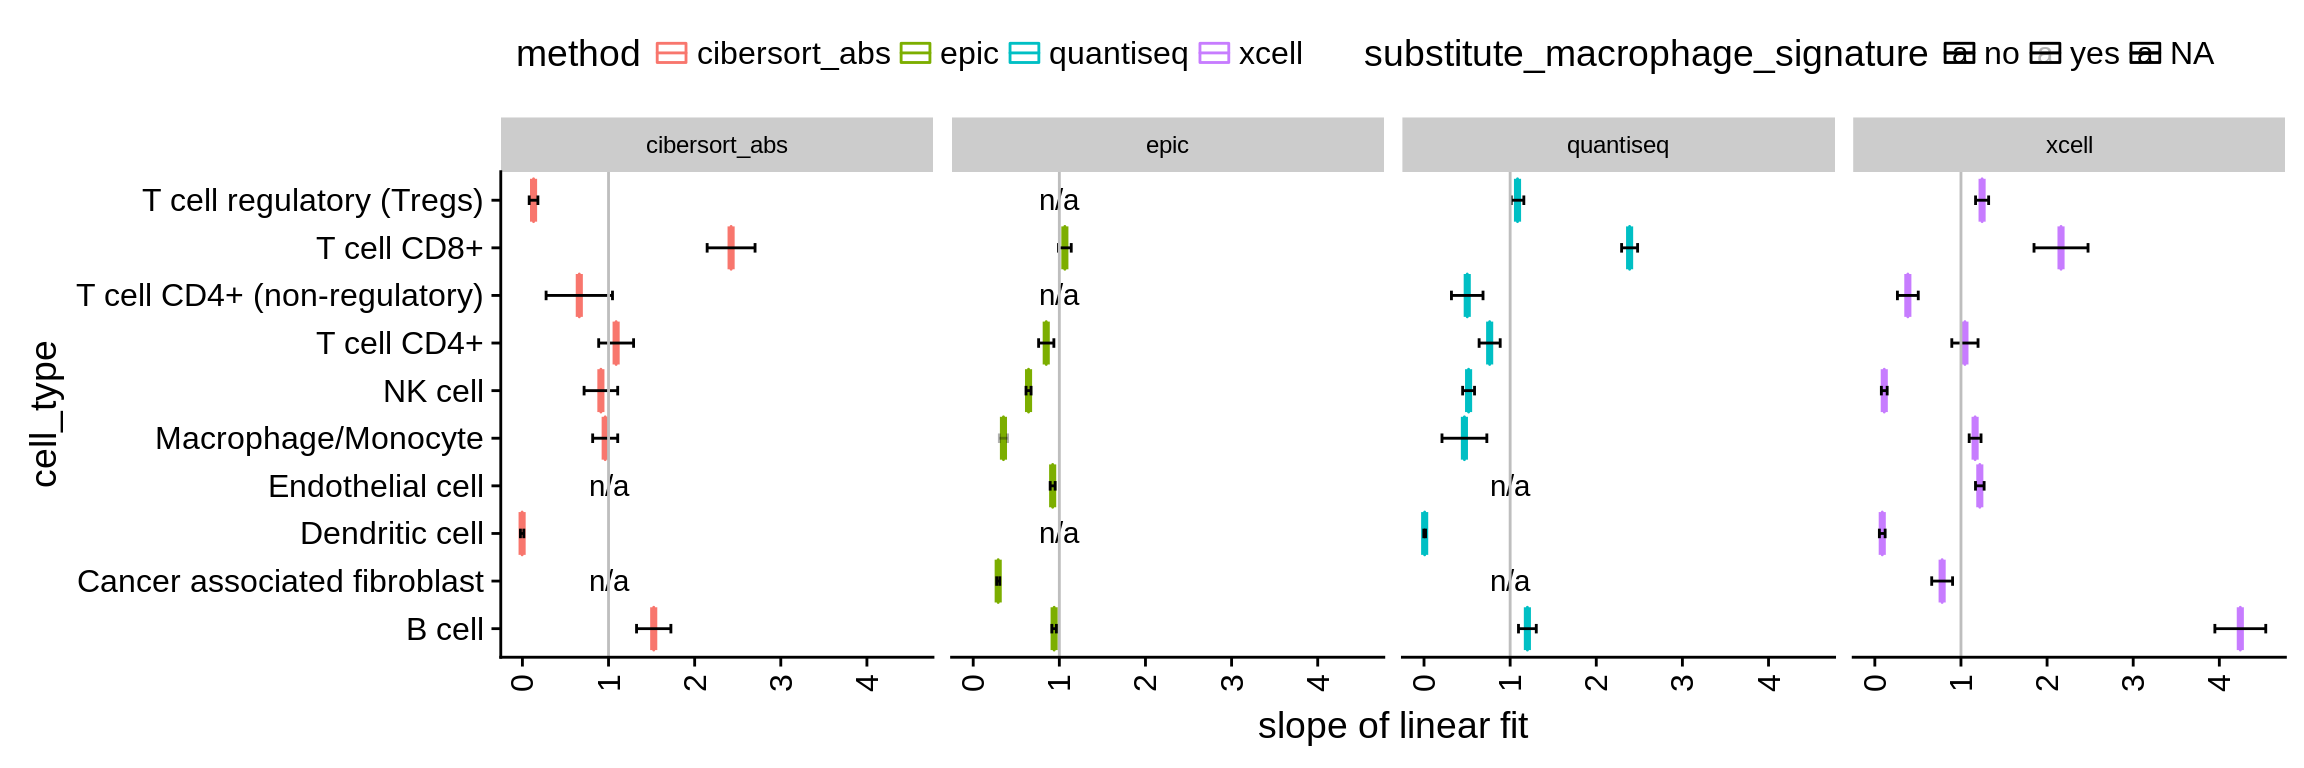
Figure 4.4: Absolute deviation of the predictions represented as the slope of a linear model. Confidence intervals are computed using confint on the result of lm.
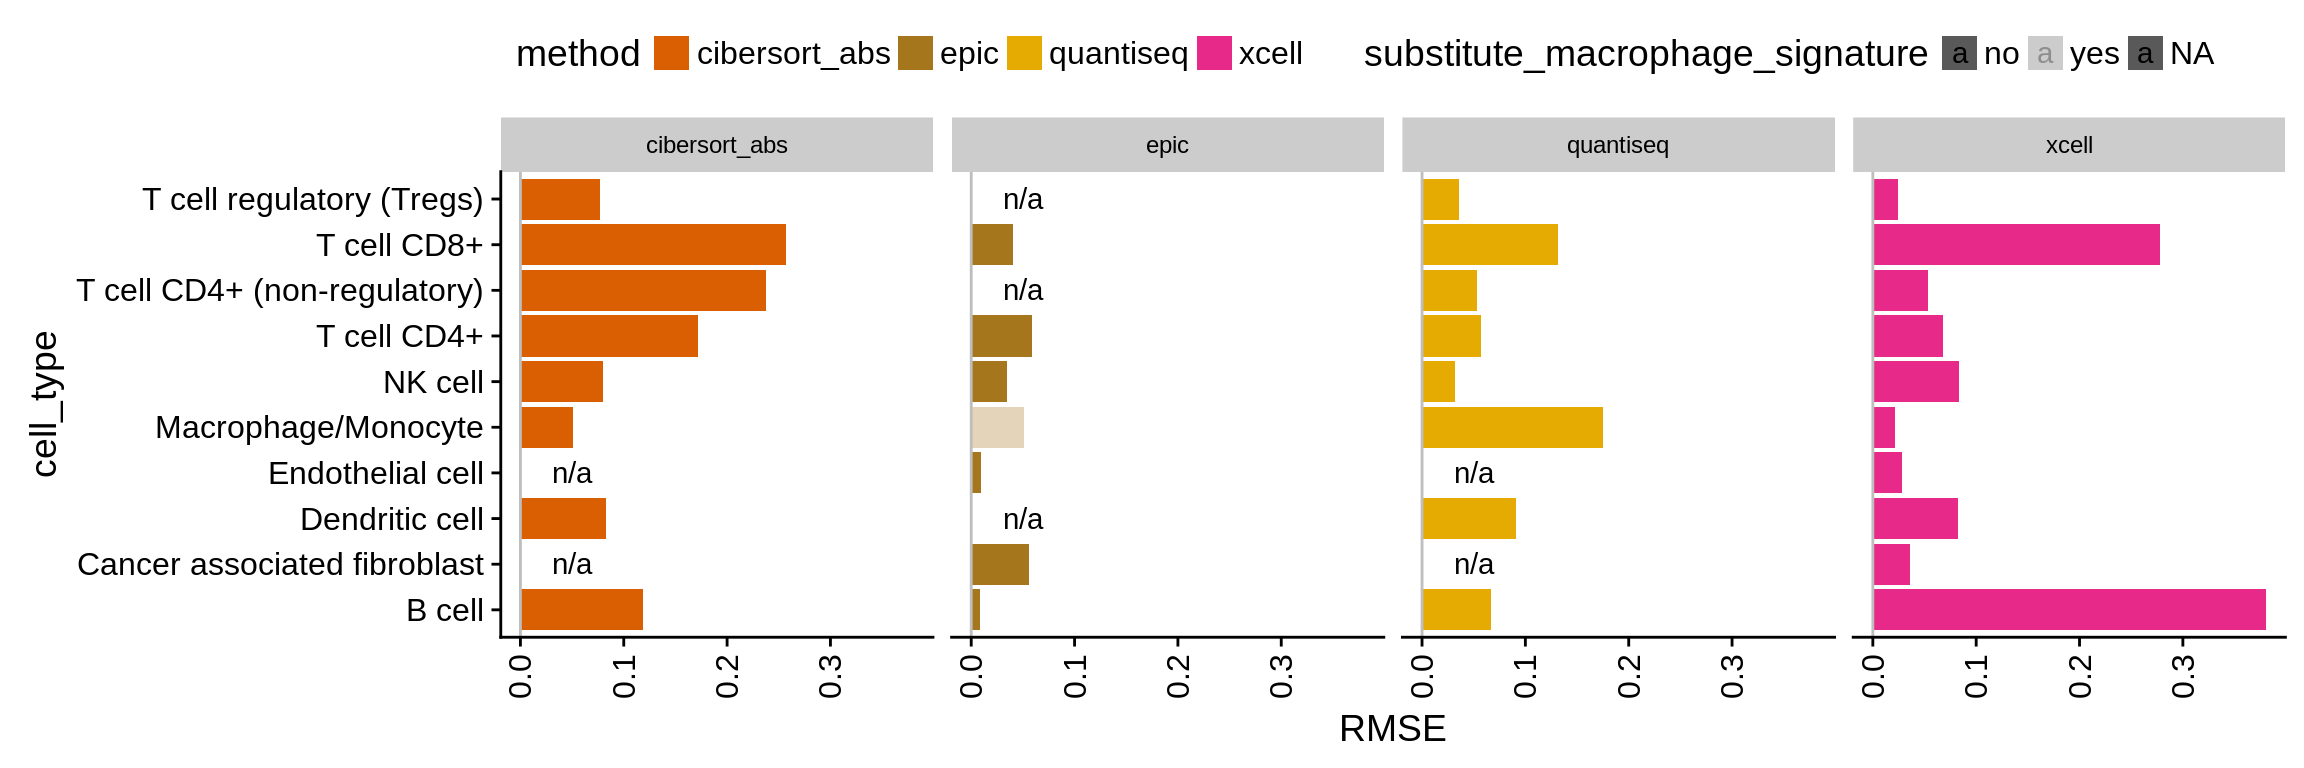
Figure 4.5: Absolute deviation of the predictions represented as RMSE.
References
Schelker, Max, Sonia Feau, Jinyan Du, Nav Ranu, Edda Klipp, Gavin MacBeath, Birgit Schoeberl, and Andreas Raue. 2017. “Estimation of immune cell content in tumour tissue using single-cell RNA-seq data.” Nature Communications 8 (1): 2032. https://doi.org/10.1038/s41467-017-02289-3.